Chapter 12 Saving Graphs
Graphs can be saved via the RStudio interface or through code.
12.1 Via menus
To save a graph using the RStudio menus, go to the Plots tab and choose Export.
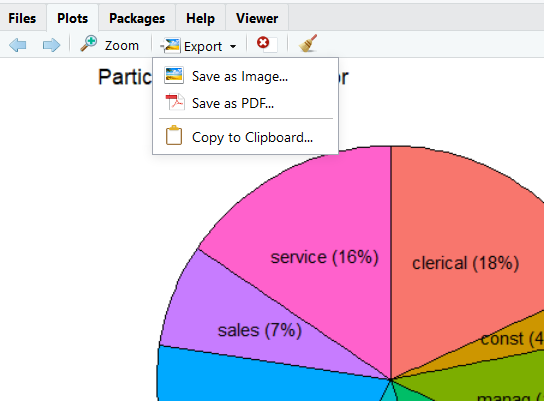
Figure 12.1: RStudio image export menu
12.2 Via code
Any ggplot2 graph can be saved as an object. Then you can use the ggsave function to save the graph to disk.
# save a graph
library(ggplot2)
p <- ggplot(mtcars,
            aes(x = wt , y = mpg)) +
  geom_point()
ggsave(p, filename = "mygraph.png")
The graph will be saved in the format defined by the file extension (png in the example above). Common formats are pdf, jpeg, tiff, png, svg, and wmf (windows only).
12.3 File formats
Graphs can be saved in several formats. The most popular choices are given below.
| Format | Extension |
|---|---|
| Portable Document Format | |
| JPEG | jpeg |
| Tagged Image File Format | tiff |
| Portable Network Graphics | png |
| Scaleable Vector Graphics | svg |
| Windows Metafile | wmf |
The pdf, svg, and wmf formats are lossless - they resize without fuzziness or pixelation. The other formats are lossy - they will pixelate when resized. This is especially noticeable when small images are enlarged.
If you are creating graphs for webpages, the png format is recommended.
The jpeg and tif formats are usually reserved for photographs.
The wmf format is usually recommended for graphs that will appear in Microsoft Word or PowerPoint documents. MS Office does not support pdf or svg files, and the wmf format will rescale well. However, note that wmf files will lose any transparency settings that have been set.
If you want to continue editing the graph after saving it, use the pdf or svg format.
12.4 External editing
Sometimes it’s difficult to get a graph just right programmatically. Most magazines and newspapers (print and electronic) fine-tune graphs after they have been created. They change the fonts, move labels around, add callouts, change colors, add additional images or logos, and the like.
If you save the graph in svg or pdf format, you can use a vector graphics editing program to modify it using point and click tools. Two popular vector graphics editors are Illustrator and Inkscape.
Inkscape (https://inkscape.org) is an opensource application that can be freely downloaded for Mac OS X, Windows, and Linux. Open the graph file in Inkscape, edit it to suite your needs, and save it in the format desired.
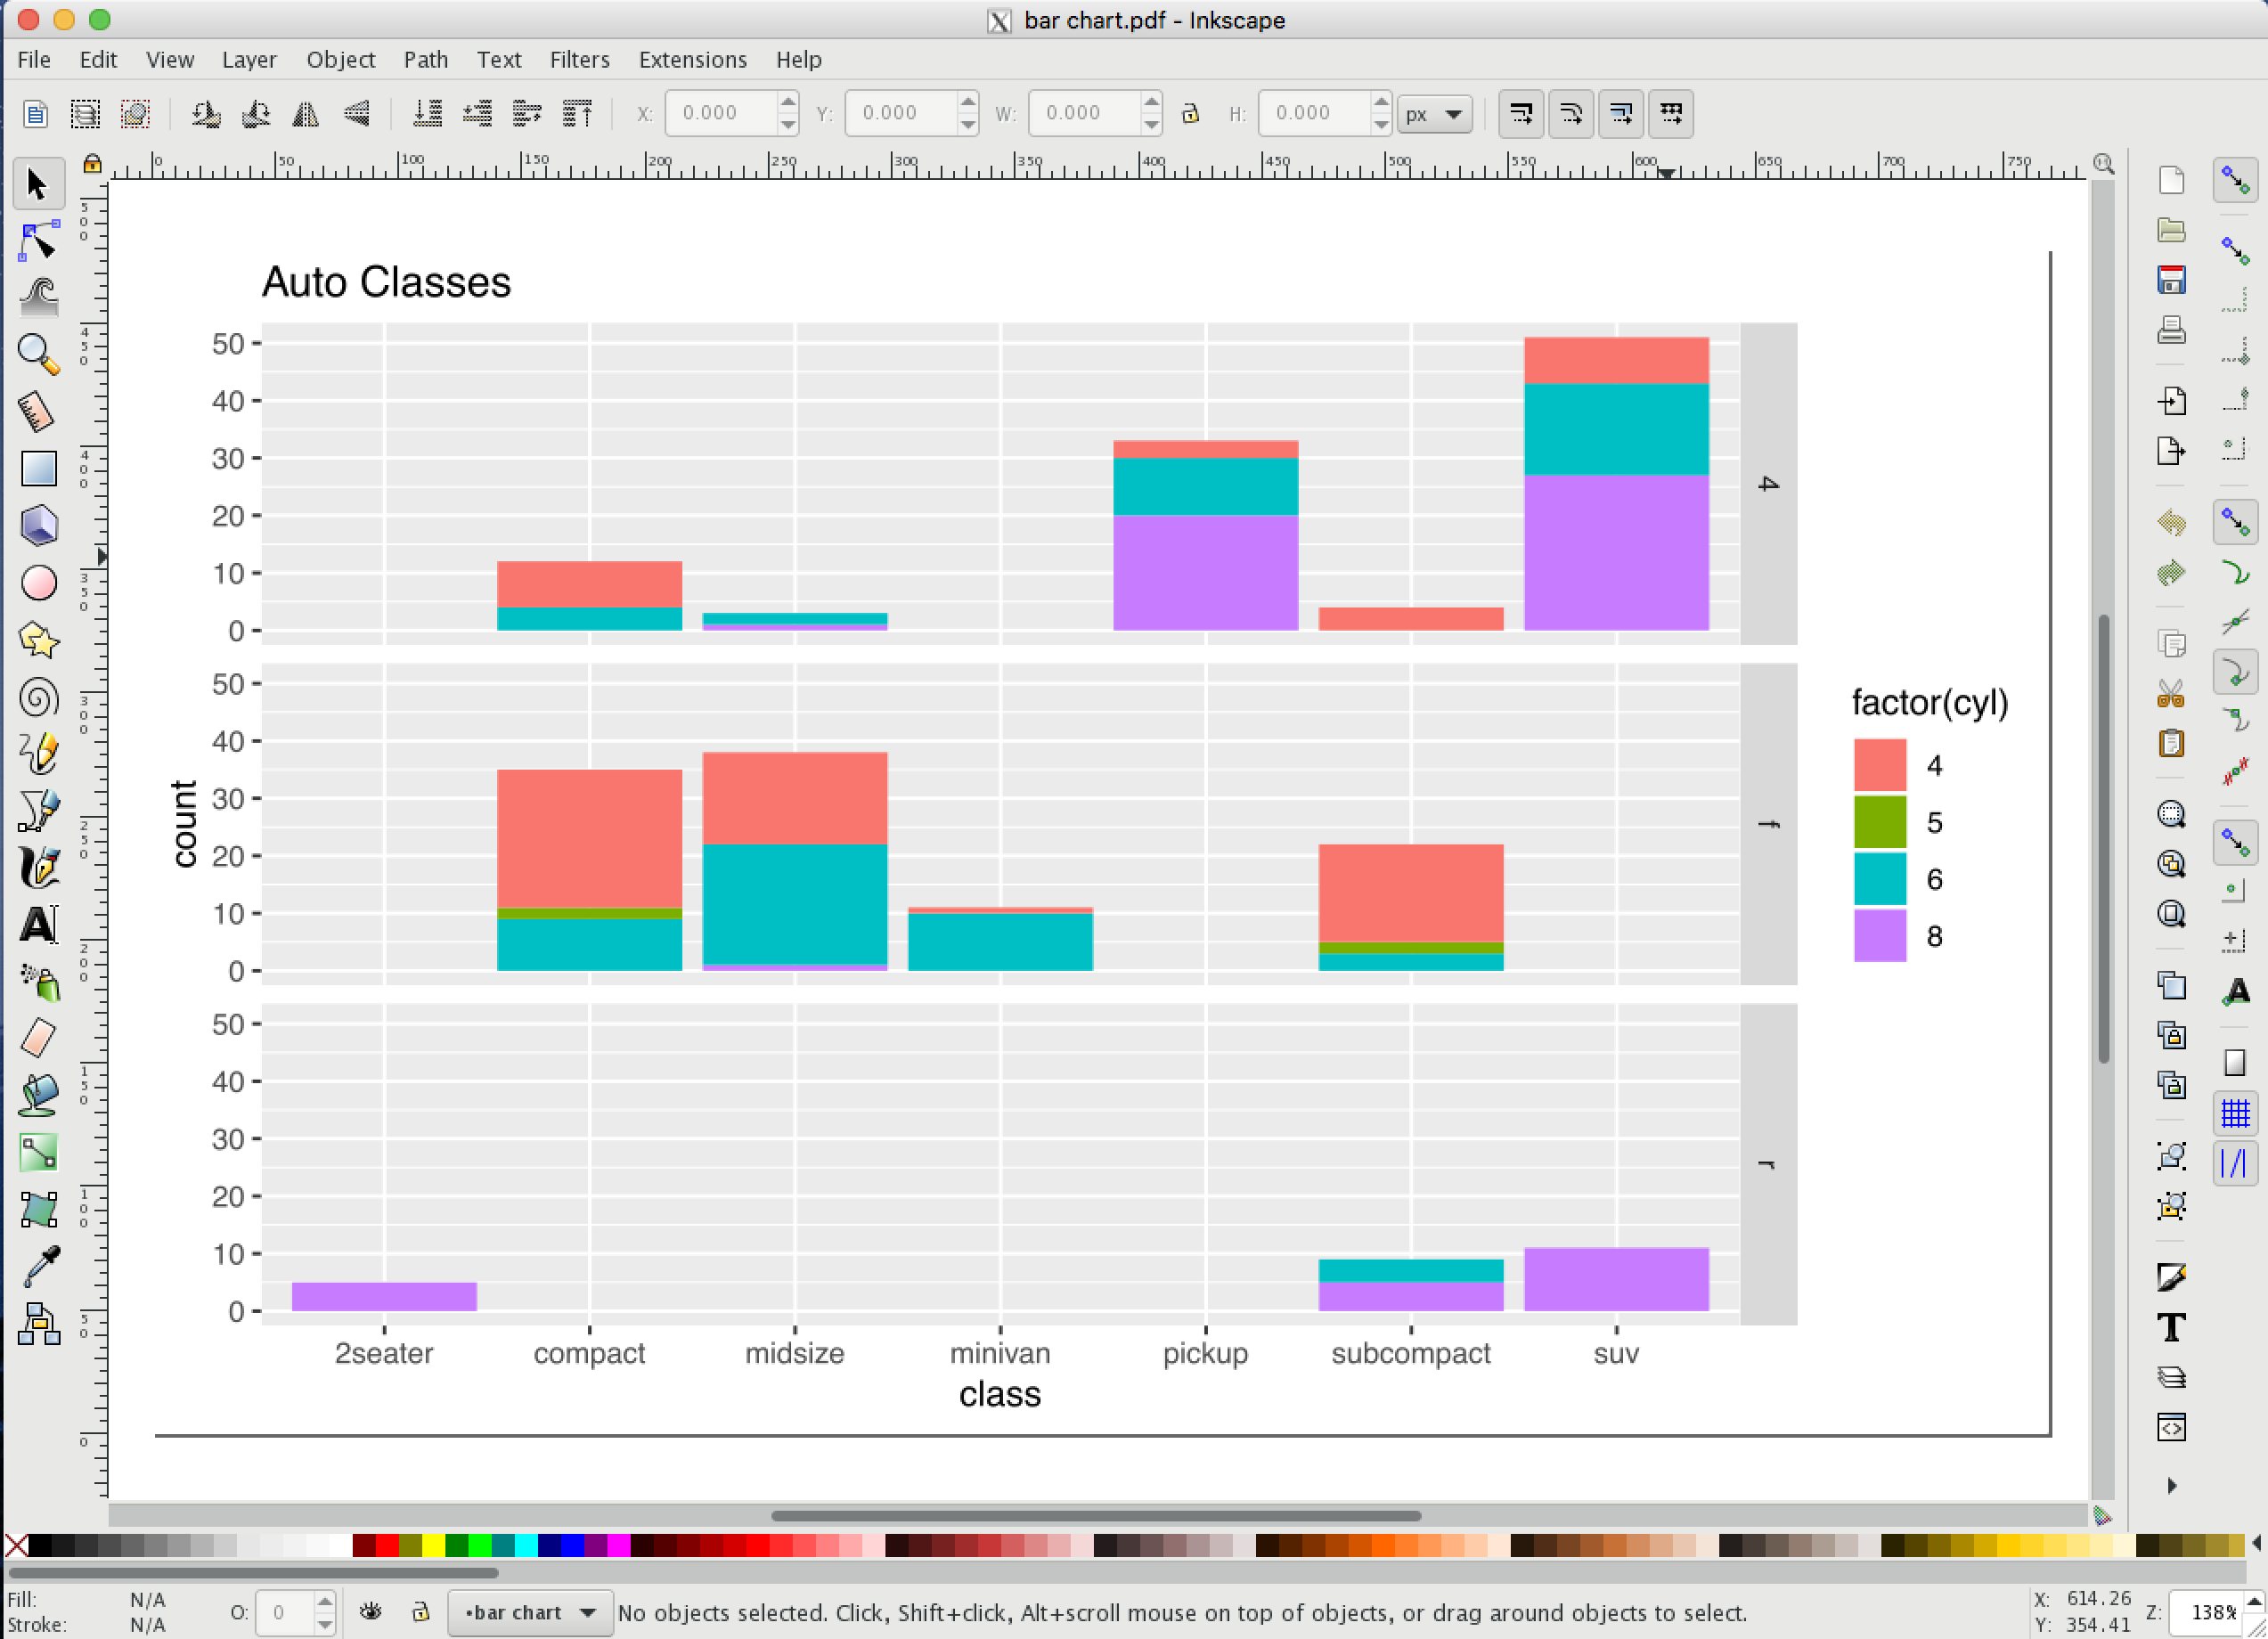
Figure 12.2: Inkscape