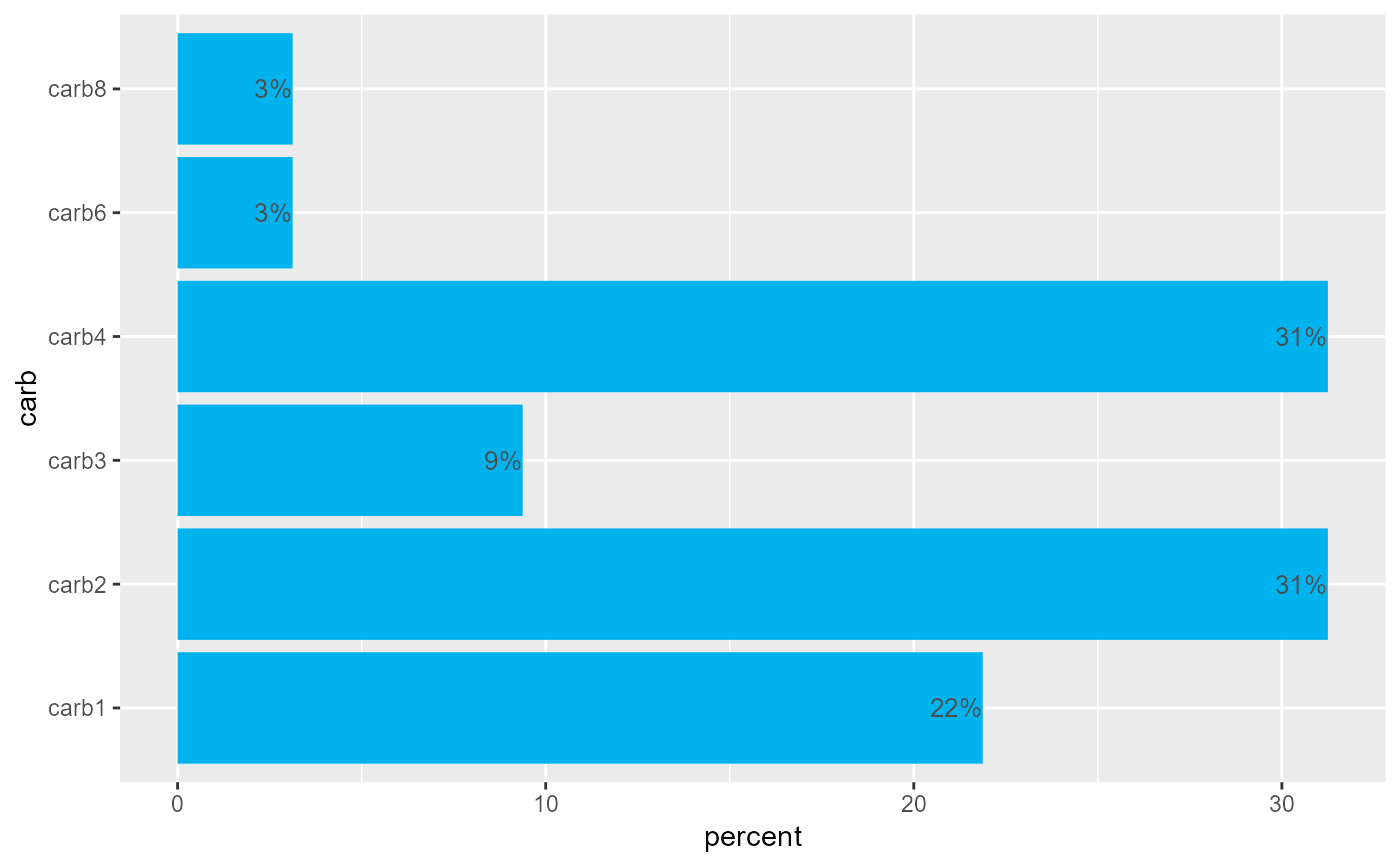
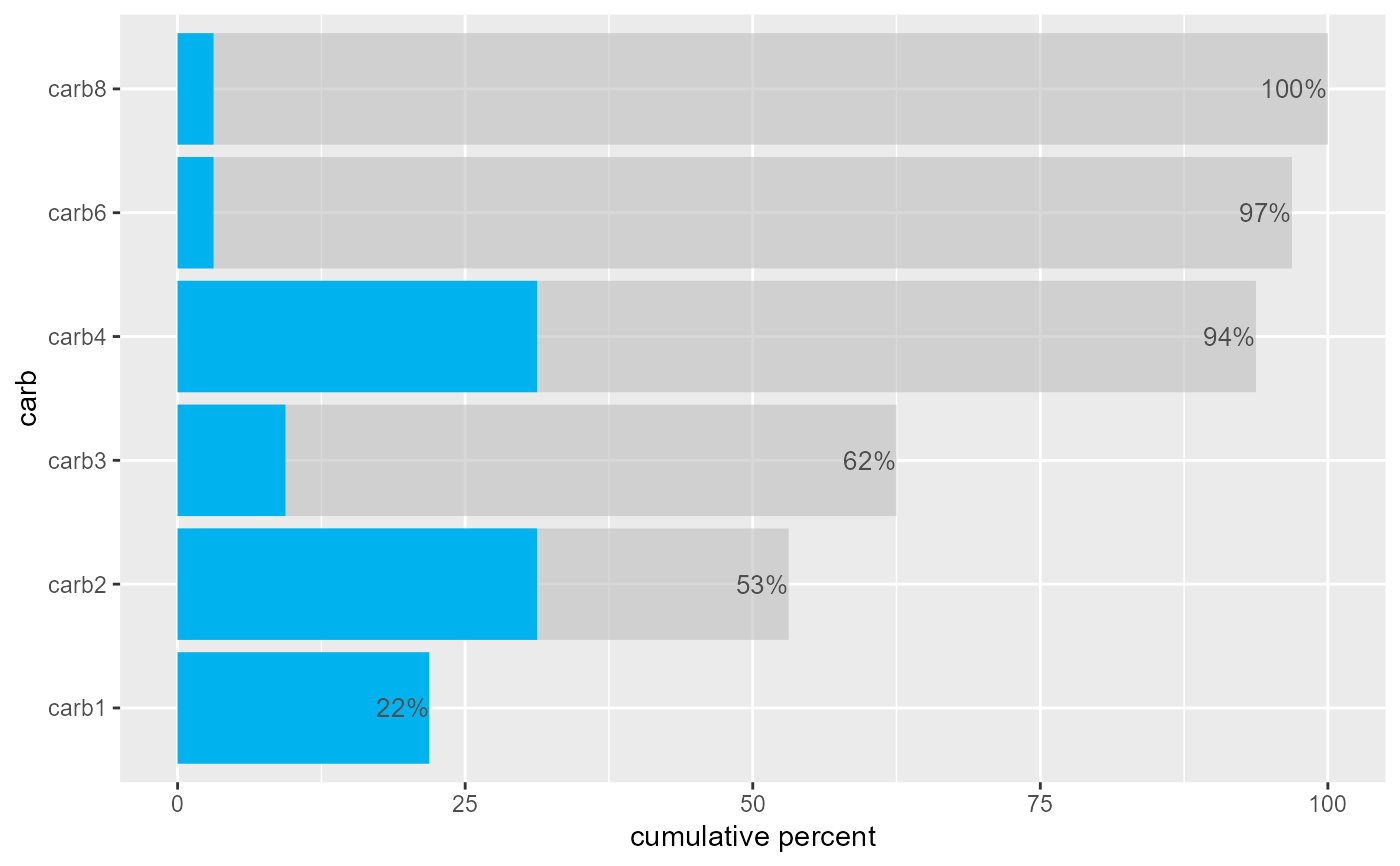
Plot a frequency or cumulative frequency table
# S3 method for tab
plot(x, fill = "deepskyblue2", size = 3.5, ...)
Arguments
- x
An object of class
tab- fill
Fill color for bars
- size
numeric. Size of bar text labels.
- ...
Parameters passed to a function
Value
a ggplot2 graph