The crosstab function calculates and prints a two-way frequency table.
Given a data frame, a row variable, a column variable, and a type (frequencies, cell percents, row percents, or column percents) the function returns a table with
- labeled rows and columns
- frequencies or percents
- a level labeled <NA> for missing values (if
na.rm = FALSE)
- a level labeled Total (unless
total = FALSE) - a Chi-square test of independence (if
chisquare = TRUE)
Tables are printed with 2 decimal places for percents (modifiable
using digits=#). Variables are coerced to factors if
necessary. Adding plot=TRUE produces a ggplot2
graph instead of a table.
In the examples below, the number of car cylinders (cyl) is cross-tabulated with the number of gears (gear) for 32 automobiles in the cars74 data frame.
Frequencies
By default, the crosstab function reports frequency counts for each combination of the two categorical variables. The most common car type has 3 gears and 8 cylinders.
crosstab(cars74, cyl, gear)
#>        gear
#> cyl     gears3 gears4 gears5 Total
#>   cyl4       1      8      2    11
#>   cyl6       2      4      1     7
#>   cyl8      12      0      2    14
#>   Total     15     12      5    32

crosstab(cars74, cyl, gear, plot=TRUE)
Cell percents
Cell percents add up to 100% overall all the cells in the table. 25% of all cars in the data frame have 4 gears and 4 cylinders.
crosstab(cars74, cyl, gear, type="percent")
#>        gear
#> cyl      gears3  gears4  gears5   Total
#>   cyl4    3.12%  25.00%   6.25%  34.38%
#>   cyl6    6.25%  12.50%   3.12%  21.88%
#>   cyl8   37.50%   0.00%   6.25%  43.75%
#>   Total  46.88%  37.50%  15.62% 100.00%

crosstab(cars74, cyl, gear, type="percent", plot=TRUE)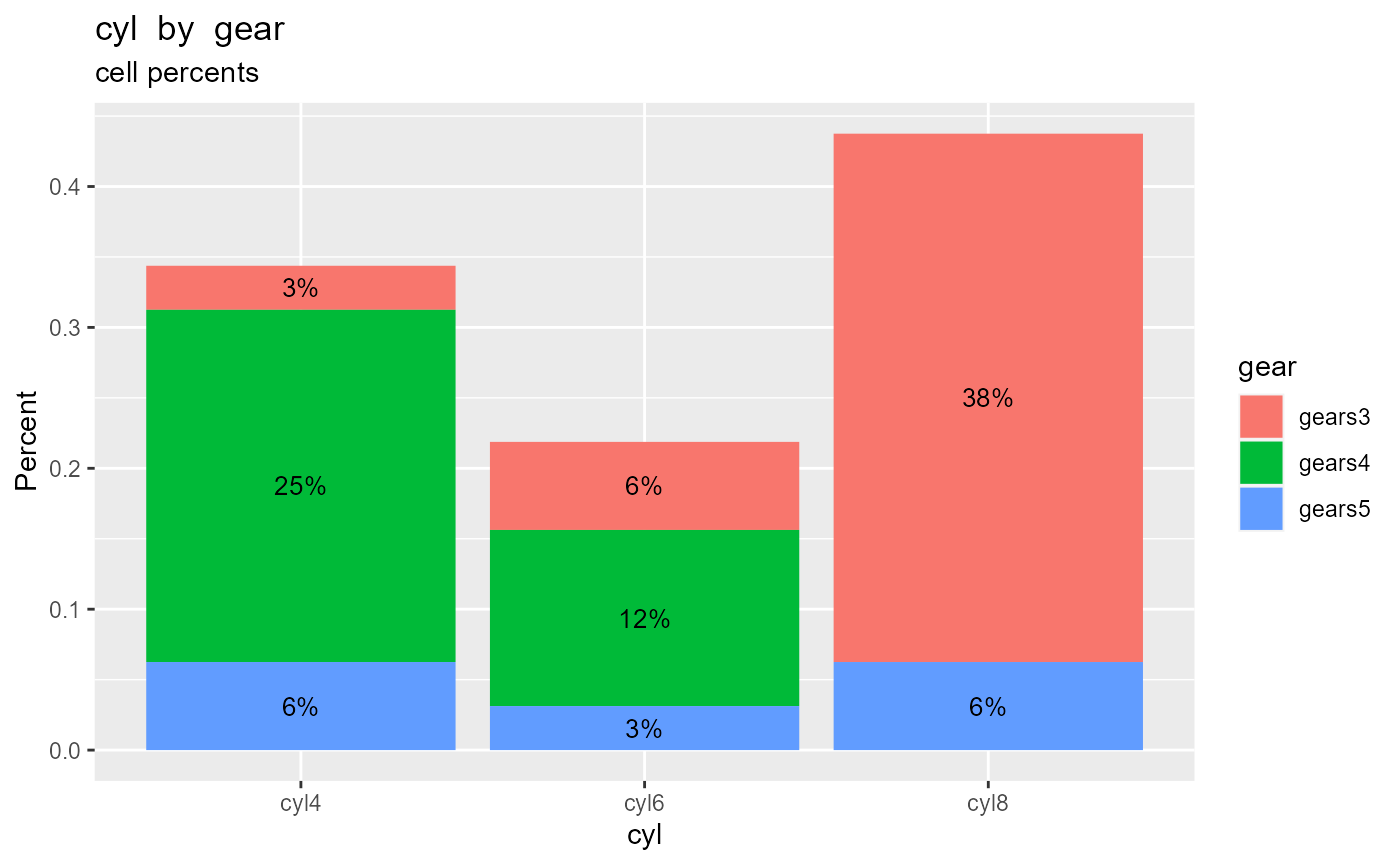
Row percents
Row percents sum to 100% for each row of the table. 86% of 8 cylinder cars have 3 gears.
crosstab(cars74, cyl, gear, type = "rowpercent")
#>       gear
#> cyl     gears3  gears4  gears5   Total
#>   cyl4   9.09%  72.73%  18.18% 100.00%
#>   cyl6  28.57%  57.14%  14.29% 100.00%
#>   cyl8  85.71%   0.00%  14.29% 100.00%

crosstab(cars74, cyl, gear, type = "rowpercent", plot=TRUE)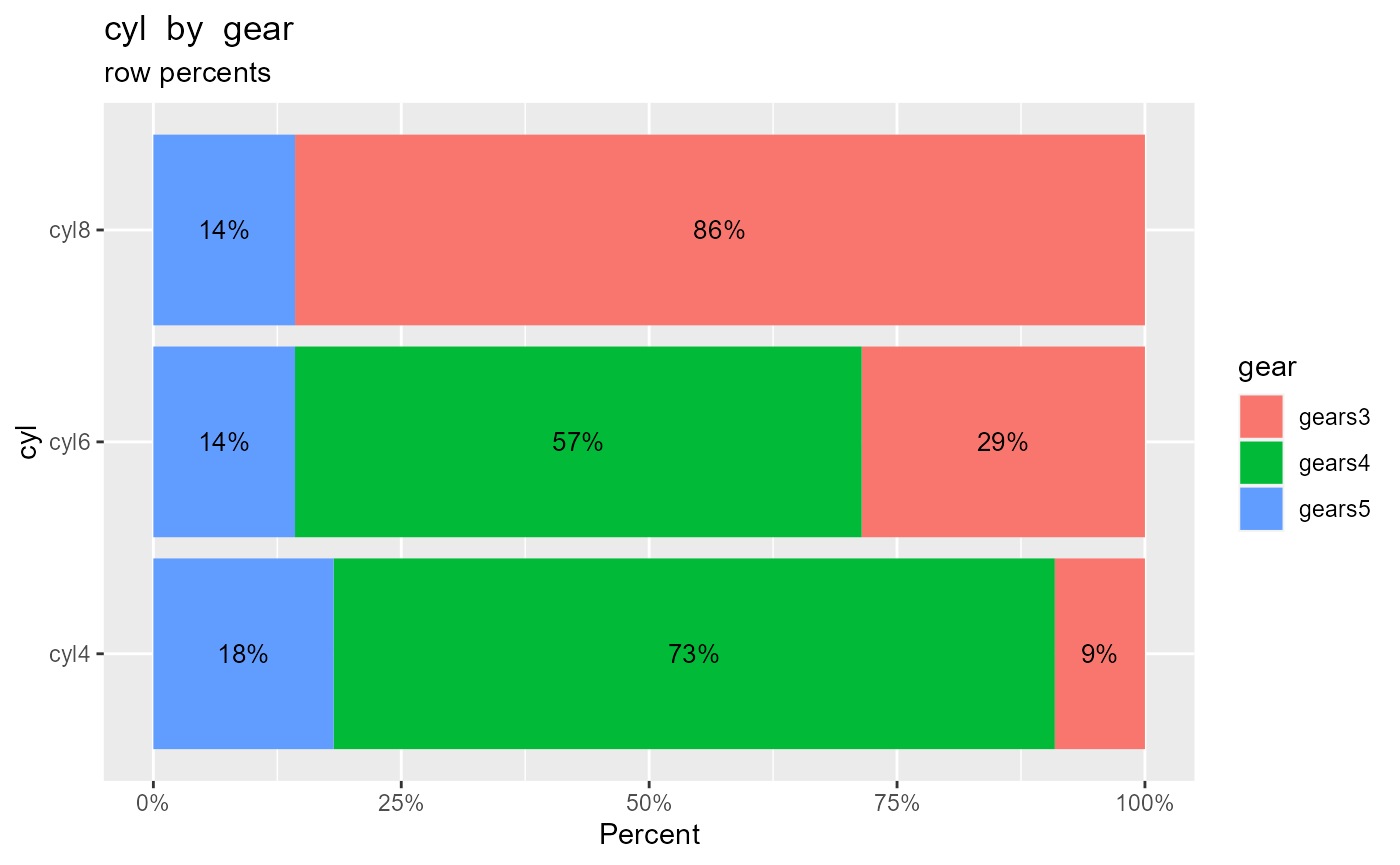
Column percents
Column percents sum to 100% for each column of the table. Only 7% of 3 gear cars have 4 cylinders.
crosstab(cars74, cyl, gear, type = "colpercent")
#>        gear
#> cyl      gears3  gears4  gears5
#>   cyl4    6.67%  66.67%  40.00%
#>   cyl6   13.33%  33.33%  20.00%
#>   cyl8   80.00%   0.00%  40.00%
#>   Total 100.00% 100.00% 100.00%

crosstab(cars74, cyl, gear, type = "colpercent", plot=TRUE)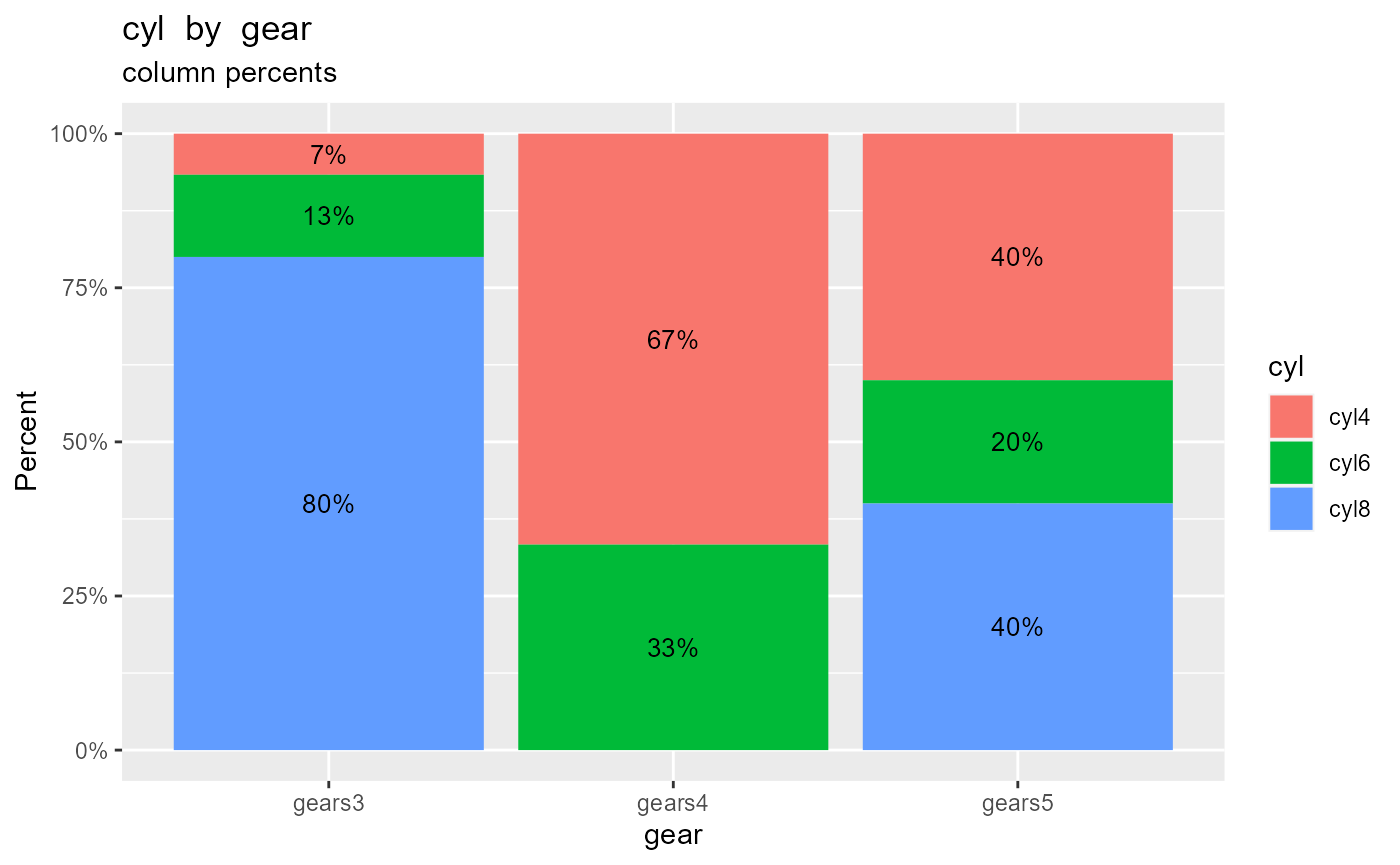
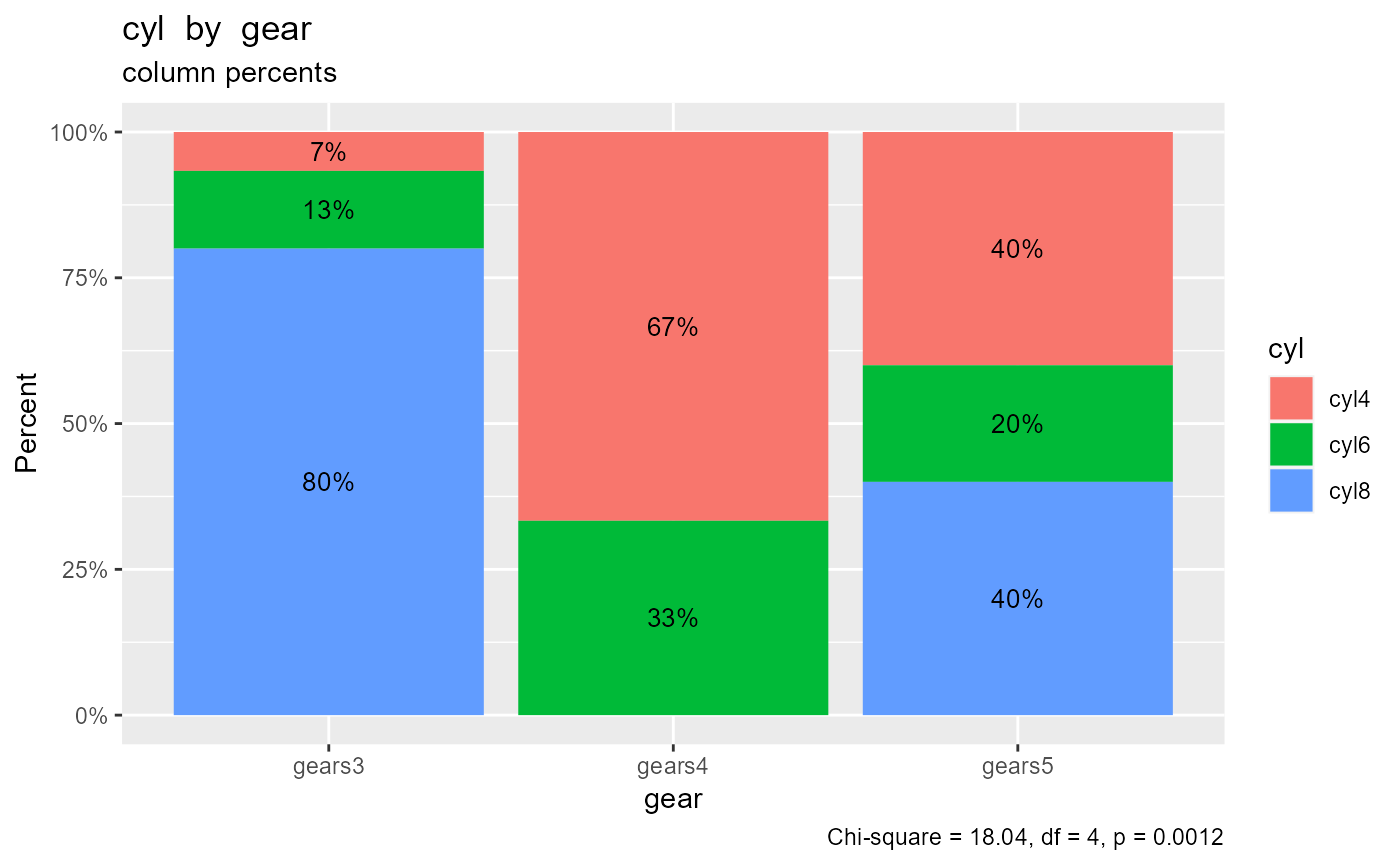
Chi-square test of independence
You can include a test that the two categorical variables are
independent, by adding the option chisquare = TRUE.
crosstab(cars74, cyl, gear, type = "colpercent", chisquare=TRUE)
#>        gear
#> cyl      gears3  gears4  gears5
#>   cyl4    6.67%  66.67%  40.00%
#>   cyl6   13.33%  33.33%  20.00%
#>   cyl8   80.00%   0.00%  40.00%
#>   Total 100.00% 100.00% 100.00%
#>
#>  Chi-square = 18.04, df = 4, p = 0.0012

crosstab(cars74, cyl, gear, type = "colpercent", plot=TRUE,
         chisquare = TRUE)