Function to calculate frequency distributions for categorical variables
tab(
  data,
  x,
  sort = FALSE,
  maxcat = NULL,
  minp = NULL,
  na.rm = FALSE,
  total = FALSE,
  digits = 2,
  cum = FALSE,
  plot = FALSE
)
Arguments
- data
A dataframe
- x
A factor variable in the data frame.
- sort
logical. Sort levels from high to low.
- maxcat
Maximum number of categories to be included. Smaller categories will be combined into an "Other" category.
- minp
Minimum proportion for a category to be included. Categories representing smaller proportions willbe combined into an "Other" category. maxcat and minp cannot both be specified.
- na.rm
logical. Removes missing values when TRUE.
- total
logical. Include a total category when TRUE.
- digits
Number of digits the percents should be rounded to.
- cum
logical. If
TRUE, include cumulative counts and percents. In this casetotalwill be set toFALSE.- plot
logical. If
TRUE, generate bar chart rather than a frequency table.
Value
If plot = TRUE return a ggplot2 bar chart. Otherwise
return a data frame.
Details
The function tab will calculate the frequency
distribution for a categorical variable and output a data frame
with three columns: level, n, percent.
Examples
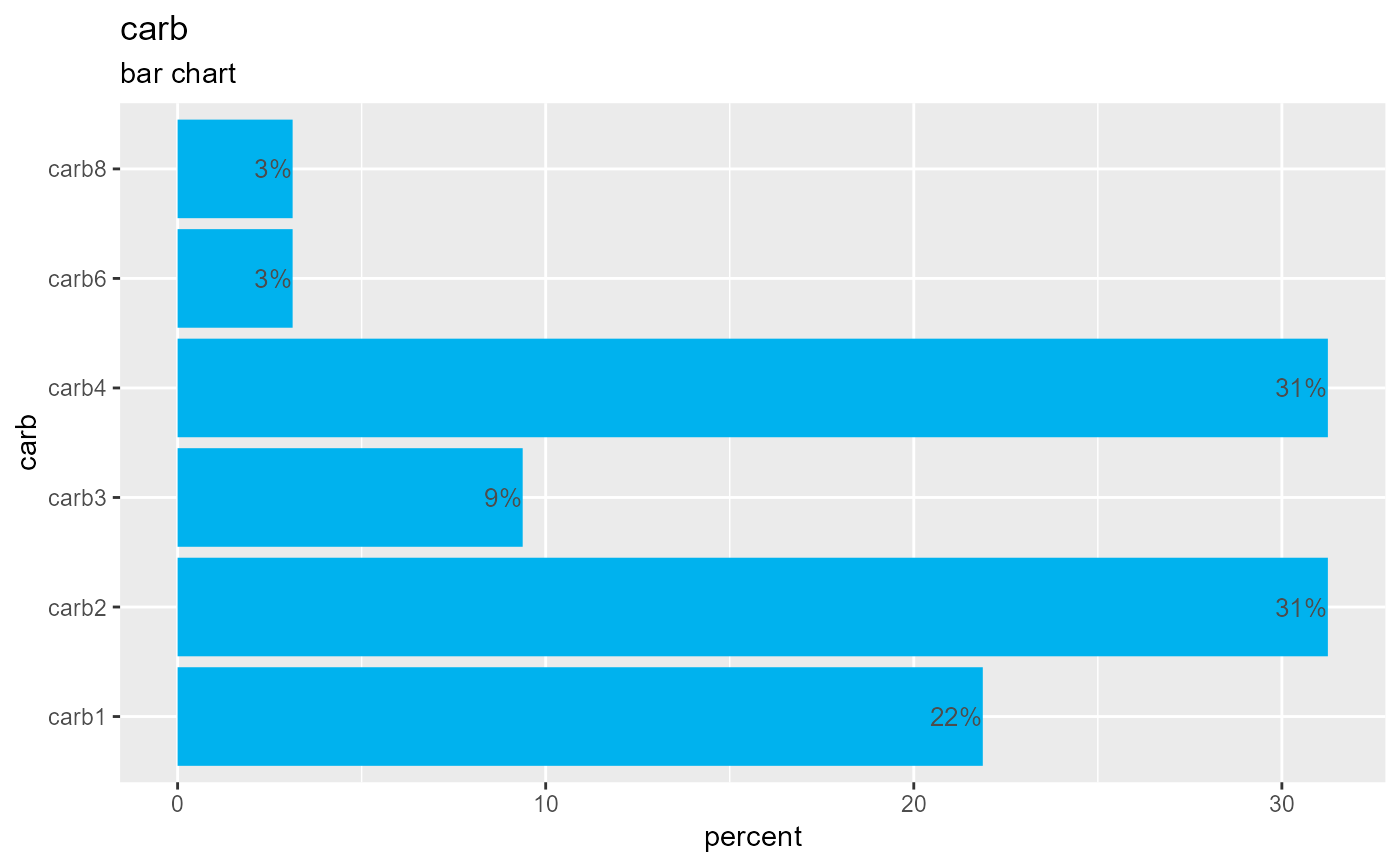
tab(cars74, carb)
#> level n percent
#> carb1 7 21.88%
#> carb2 10 31.25%
#> carb3 3 9.38%
#> carb4 10 31.25%
#> carb6 1 3.12%
#> carb8 1 3.12%
tab(cars74, carb, plot=TRUE)
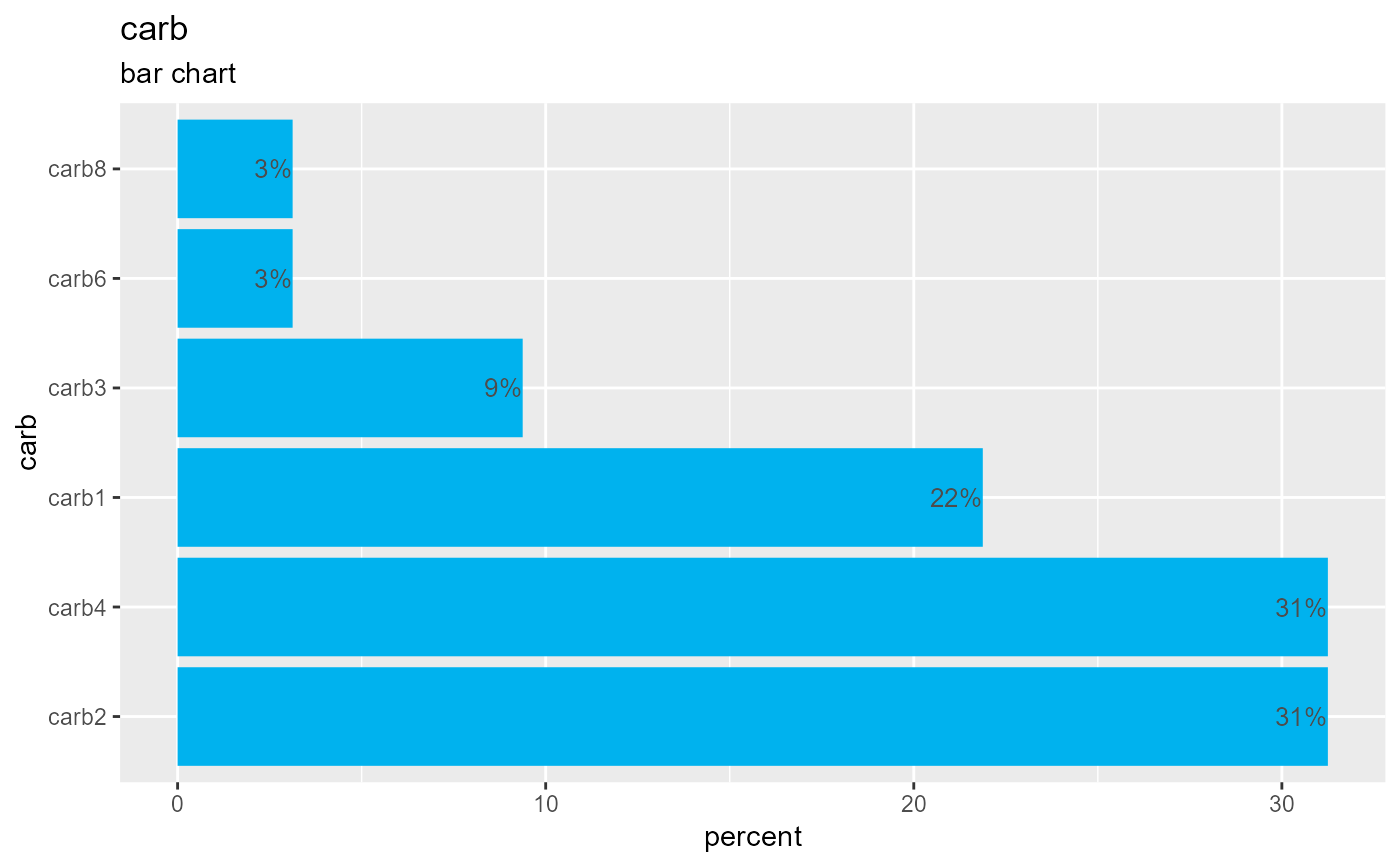
 tab(cars74, carb, sort=TRUE)
#> level n percent
#> carb2 10 31.25%
#> carb4 10 31.25%
#> carb1 7 21.88%
#> carb3 3 9.38%
#> carb6 1 3.12%
#> carb8 1 3.12%
tab(cars74, carb, sort=TRUE, plot=TRUE)
tab(cars74, carb, sort=TRUE)
#> level n percent
#> carb2 10 31.25%
#> carb4 10 31.25%
#> carb1 7 21.88%
#> carb3 3 9.38%
#> carb6 1 3.12%
#> carb8 1 3.12%
tab(cars74, carb, sort=TRUE, plot=TRUE)
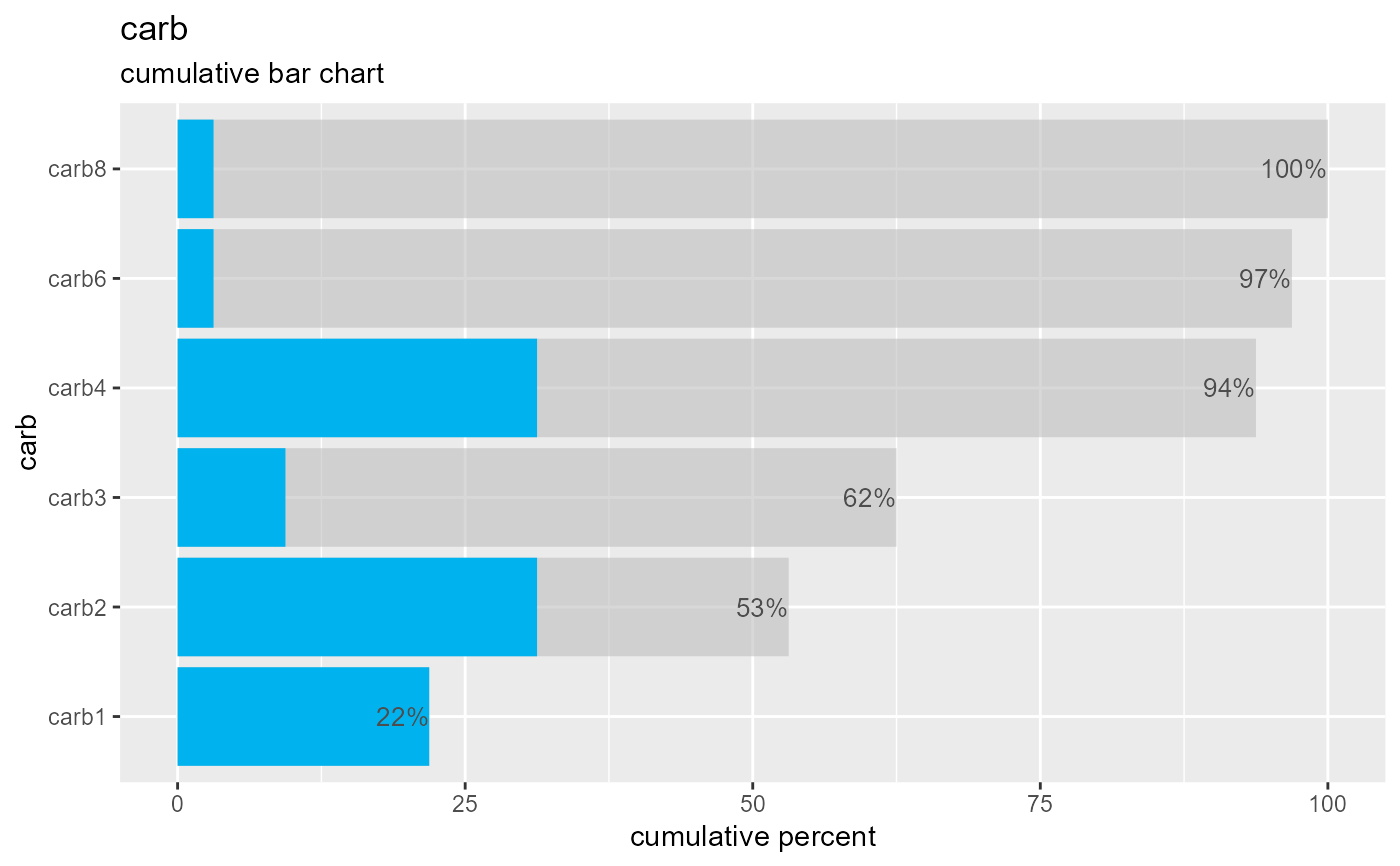
 tab(cars74, carb, cum=TRUE)
#> level n percent cum_n cum_percent
#> carb1 7 21.88% 7 21.88%
#> carb2 10 31.25% 17 53.12%
#> carb3 3 9.38% 20 62.5%
#> carb4 10 31.25% 30 93.75%
#> carb6 1 3.12% 31 96.88%
#> carb8 1 3.12% 32 100%
tab(cars74, carb, cum=TRUE, plot=TRUE)
tab(cars74, carb, cum=TRUE)
#> level n percent cum_n cum_percent
#> carb1 7 21.88% 7 21.88%
#> carb2 10 31.25% 17 53.12%
#> carb3 3 9.38% 20 62.5%
#> carb4 10 31.25% 30 93.75%
#> carb6 1 3.12% 31 96.88%
#> carb8 1 3.12% 32 100%
tab(cars74, carb, cum=TRUE, plot=TRUE)