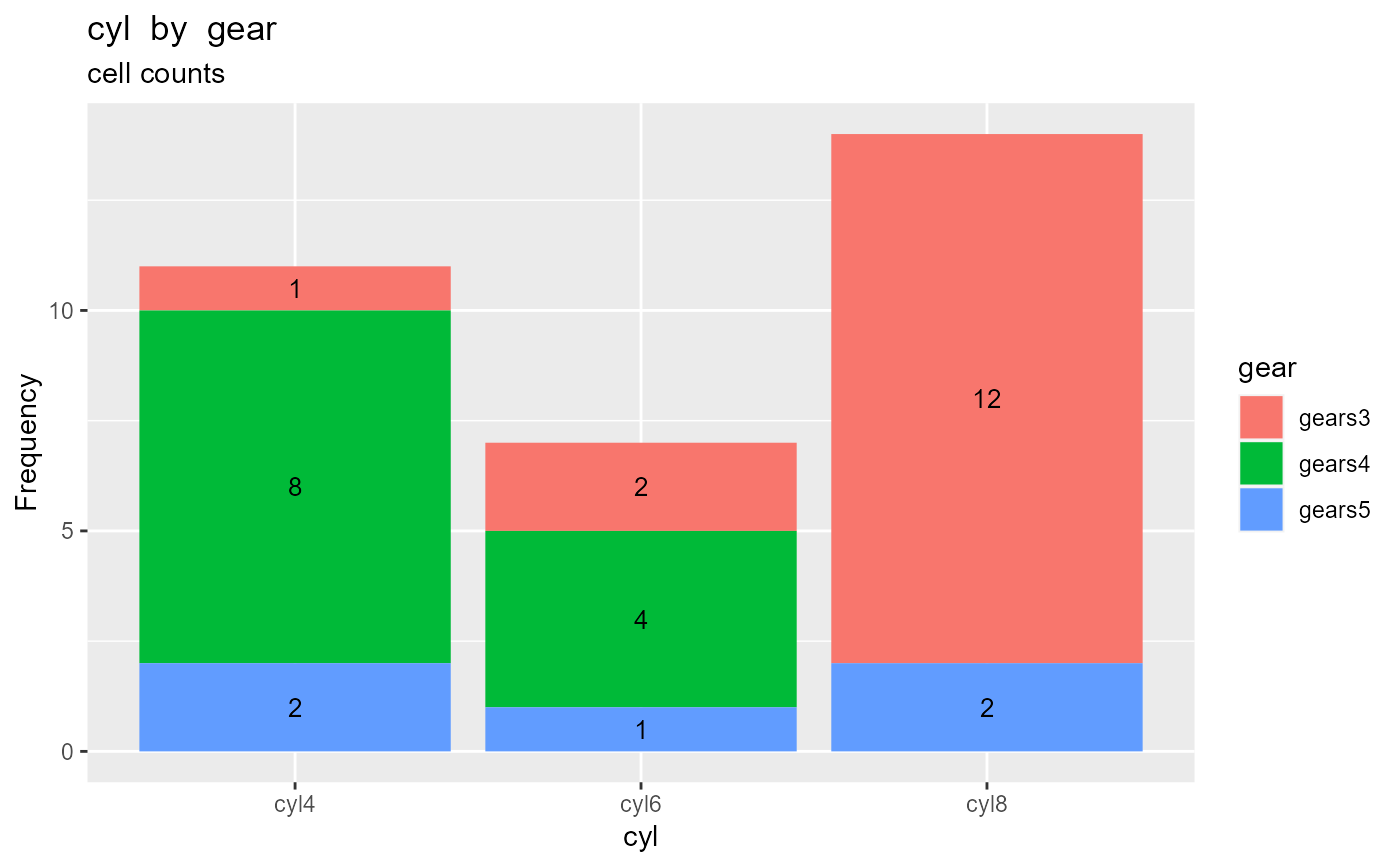
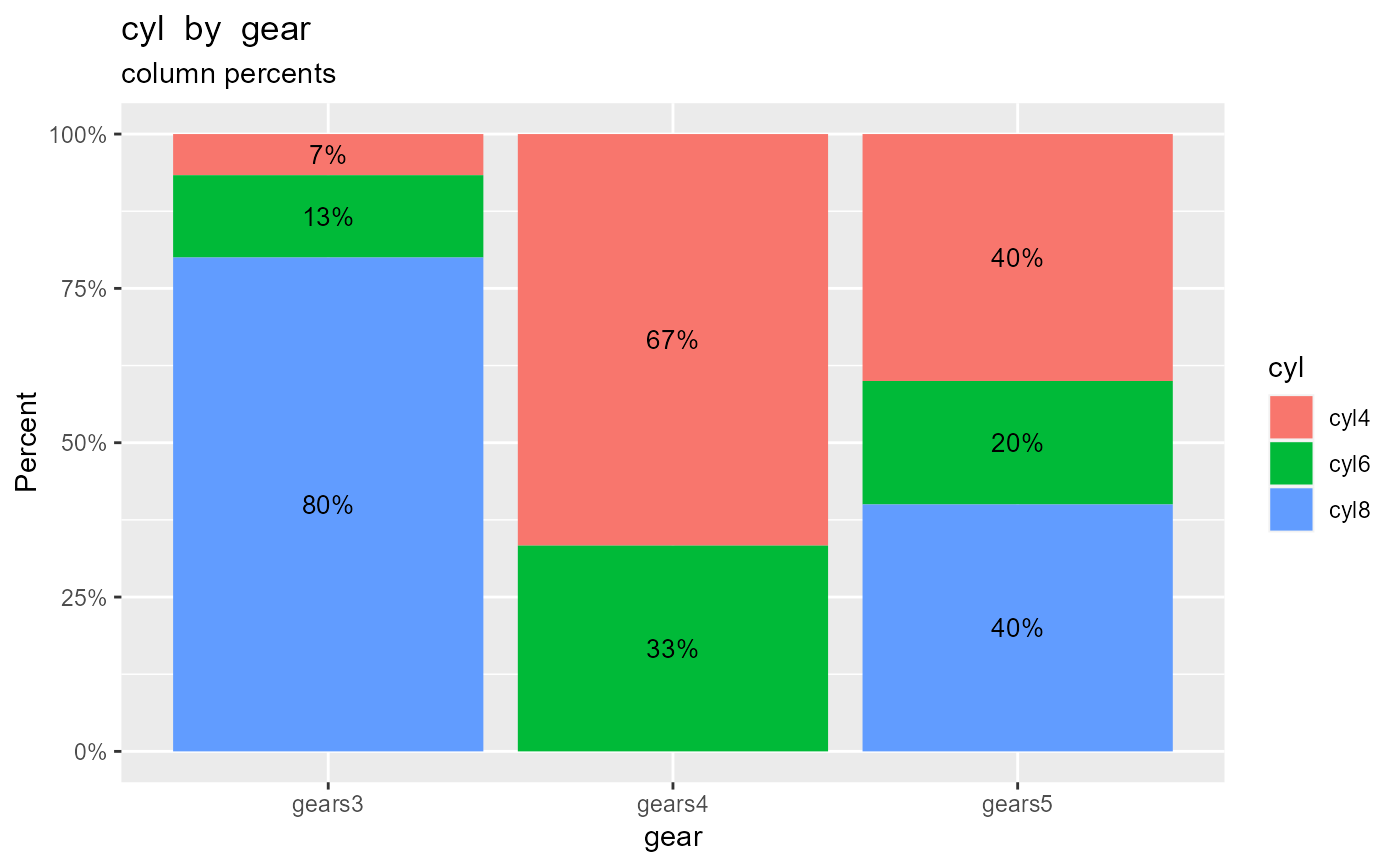
This function plots the results of a calculated two-way frequency table.
# S3 method for crosstab
plot(x, size = 3.5, ...)
Arguments
- x
An object of class
crosstab- size
numeric. Size of bar text labels.
- ...
no currently used.
Value
a ggplot2 graph
This function plots the results of a calculated two-way frequency table.
# S3 method for crosstab
plot(x, size = 3.5, ...)An object of class crosstab
numeric. Size of bar text labels.
no currently used.
a ggplot2 graph