This function creates a two way frequency table.
crosstab(
  data,
  rowvar,
  colvar,
  type = c("freq", "percent", "rowpercent", "colpercent"),
  total = TRUE,
  na.rm = TRUE,
  digits = 2,
  chisquare = FALSE,
  plot = FALSE
)
Arguments
- data
data frame
- rowvar
row factor (unquoted)
- colvar
column factor (unquoted)
- type
statistics to print. Options are
"freq","percent","rowpercent", or"colpercent"for frequencies, cell percents, row percents, or column percents).- total
logical. if TRUE, includes total percents.
- na.rm
logical. if TRUE, deletes cases with missing values.
- digits
number of decimal digits to report for percents.
- chisquare
logical. If
TRUEperform a chi-square test of independence- plot
logical. If
TRUEgenerate stacked bar chart.
Value
If plot=TRUE, return a ggplot2 graph.
Otherwise the function return a list with 6 components:
table(table). Table of frequencies or percentstype(character). Type of table to printtotal(logical). IfTRUE, print row and or column totalsdigits(numeric). number of digits to printrowname(character). Row variable namecolname(character). Column variable namechisquare(character). Ifchisquare=TRUE, contains the results of the Chi-square test.NULLotherwise.
Details
Given a data frame, a row factor, a column factor, and a type (frequencies, cell percents, row percents, or column percents) the function provides the requested cross-tabulation.
If na.rm = FALSE, a level labeled <NA> added. If
total = TRUE, a level labeled Total is added. If
chisquare = TRUE, a chi-square test of independence is
performed.
See also
Examples
# print frequencies
crosstab(mtcars, cyl, gear)
#> gear
#> cyl 3 4 5 Total
#> 4 1 8 2 11
#> 6 2 4 1 7
#> 8 12 0 2 14
#> Total 15 12 5 32
# print cell percents
crosstab(cardata, vehicle_size, driven_wheels)
#> driven_wheels
#> vehicle_size all wheel drive four wheel drive front wheel drive
#> Compact 646 407 2491
#> Large 438 737 389
#> Midsize 1269 259 1907
#> Total 2353 1403 4787
#> driven_wheels
#> vehicle_size rear wheel drive Total
#> Compact 1220 4764
#> Large 1213 2777
#> Midsize 938 4373
#> Total 3371 11914
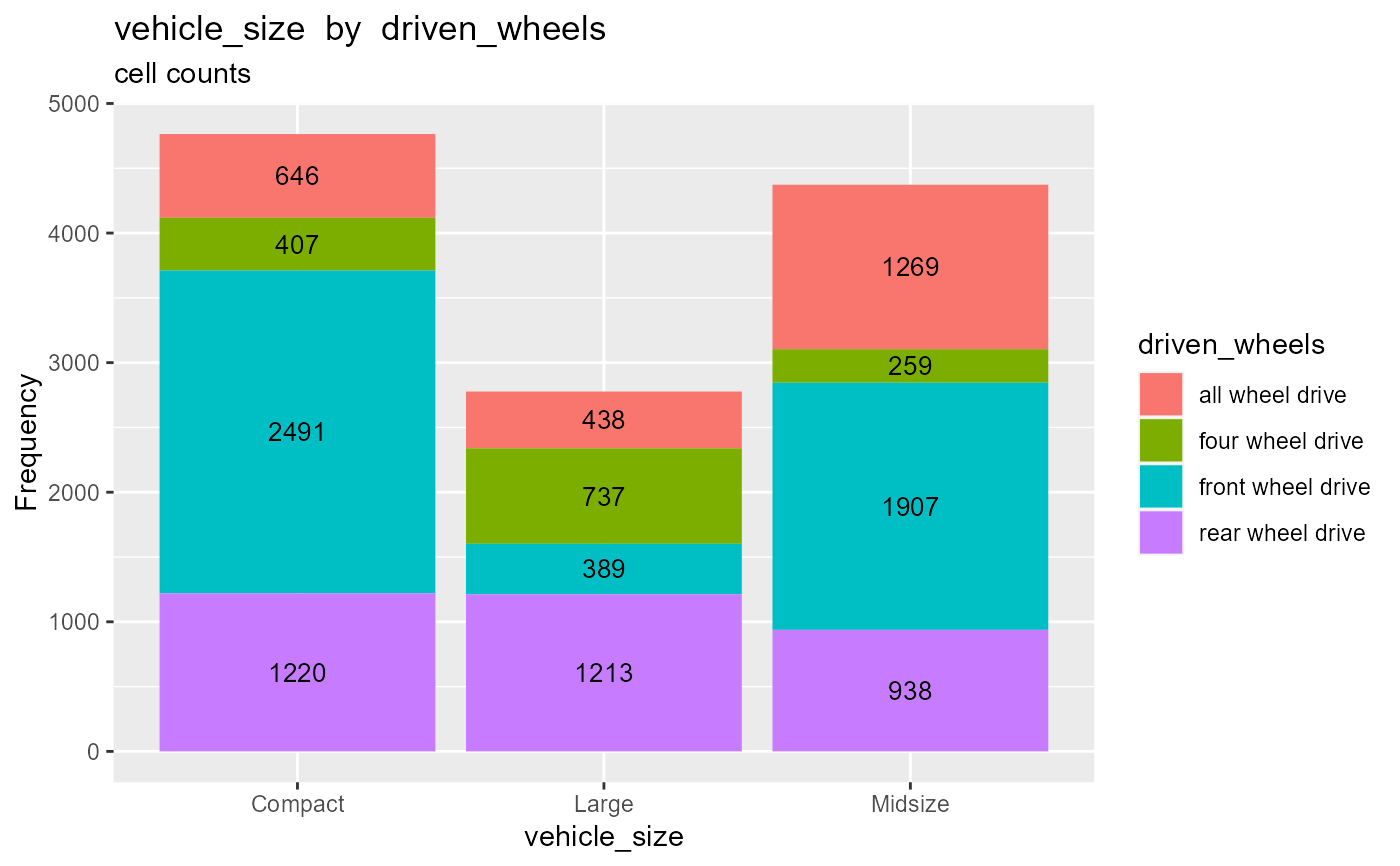
crosstab(cardata, vehicle_size, driven_wheels,
plot=TRUE)
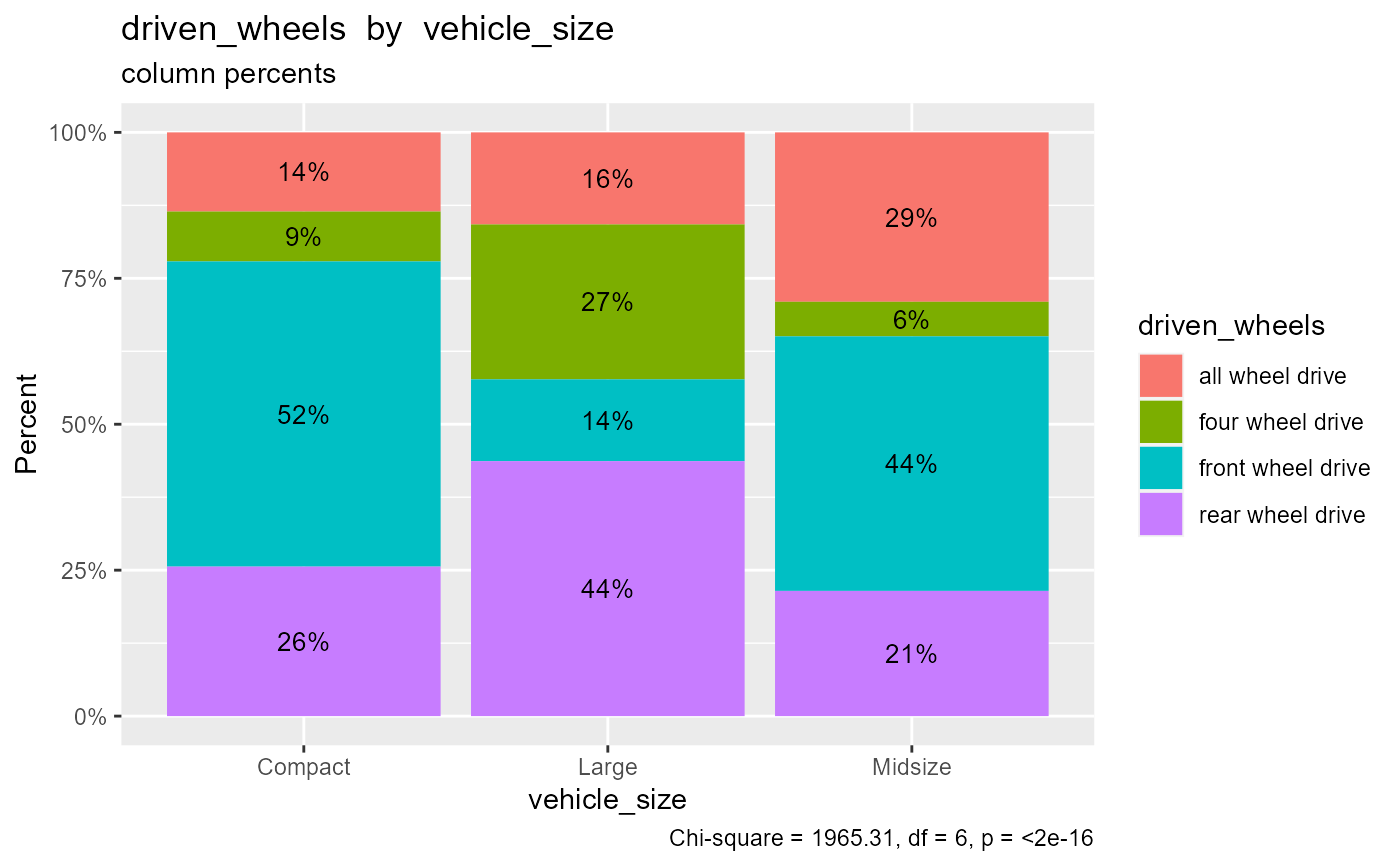
 crosstab(cardata, driven_wheels, vehicle_size,
type="colpercent", plot=TRUE, chisquare=TRUE)
crosstab(cardata, driven_wheels, vehicle_size,
type="colpercent", plot=TRUE, chisquare=TRUE)