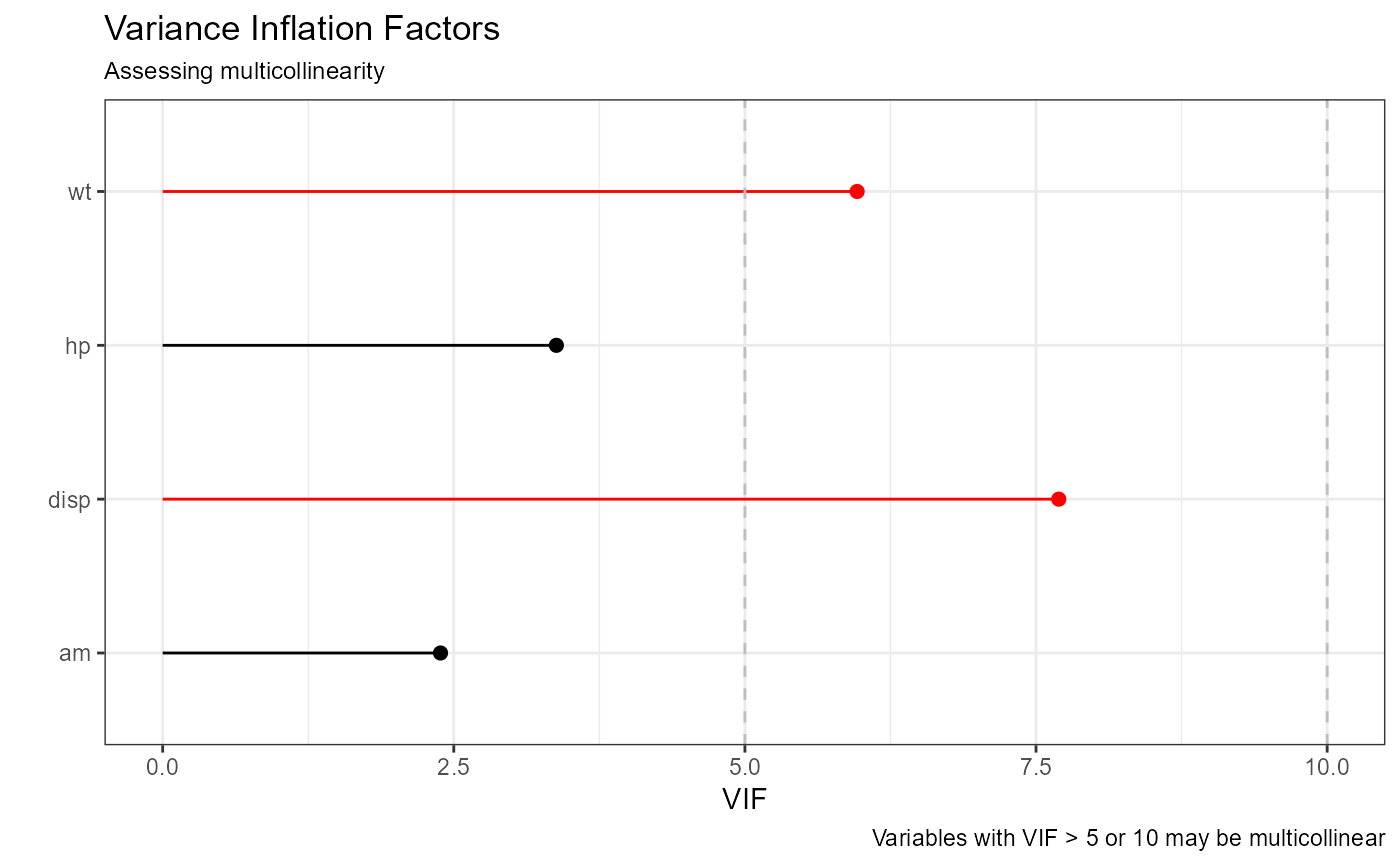
Variance Inflation Plot
vif_plot.RdPlots the variance inflations factors (VIF) for a linear model.
vif_plot(x)Arguments
- x
an object of class
"lm".
Value
a ggplot2 graph
Details
This function plots results from the vif function from
the car package. VIFs larger than 5 are highlighted.
If all terms in an unweighted linear model have 1 df, then the usual variance-inflation factors are calculated. If any terms in an unweighted linear model have more than 1 df, then generalized variance-inflation factors (Fox and Monette, 1992) are calculated.
References
Fox, J. and Monette, G. (1992) Generalized collinearity diagnostics. JASA, 87, 178–183.
