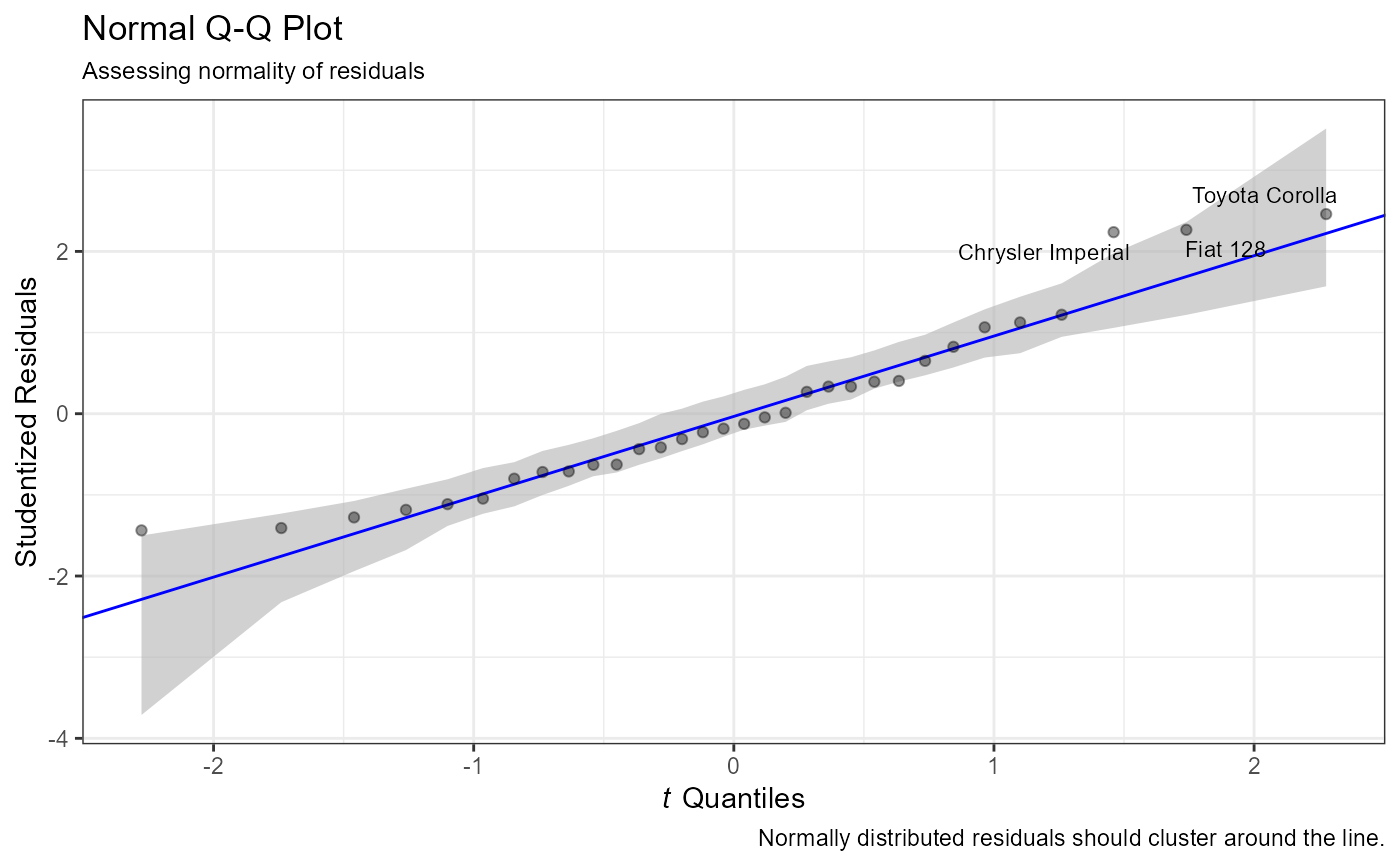
Normal Q-Q Plot
qq_plot.RdPlots empirical quantiles of the studentized residuals from a linear model against the theoretical quantiles of a the normal distribution.
qq_plot(x, reps = 100, conf = 0.95, n.labels = 3, alpha = 0.4)Arguments
- x
an object of class
"lm".- reps
integer; number of bootstrap replications for the confidence envelope (default=100)
- conf
numeric; size of confidence interval (default=
0.95).- n.labels
integer; the number of largest residuals to label ( default = 3).
- alpha
numeric; transparency for plotted points (0 to 1, default=0.4).
Value
a ggplot2 graph
