Model Performance
performance.RdIndices of model performance for linear and logistic regression models. The output depends on the form of the model (linear or logistic regression).
performance(x, ...)Arguments
- x
an object of type
"lm"or"glm".- ...
further arguments passed to or from other methods.
Value
The results of the methods performance.lm or
performance.glm
Details
The performance function can be used to evaluate the predictive
performance of a model with new data. If a data frame is not
specified, the performance is evaluated on the training data
(i.e., the data contained in the model component of the lm or
glm object).
See also
Examples
#######################
# multiple regression #
#######################
fit <- lm(mpg ~ hp + wt + accel + origin, data = auto_mpg)
performance(fit)
#> Multiple Regression Performance
#> Data:  auto_mpg
#> N:     388
#>
#> Model: lm(formula = mpg ~ hp + wt + accel + origin, data = auto_mpg)
#>
#>     RMSE Rsquared      MAE
#>   4.1385   0.7184   3.1518

#######################
# logistic regression #
#######################
fit2 <- glm(caesarian ~ age + bp + delivery.time, family = binomial, data = caesarian)
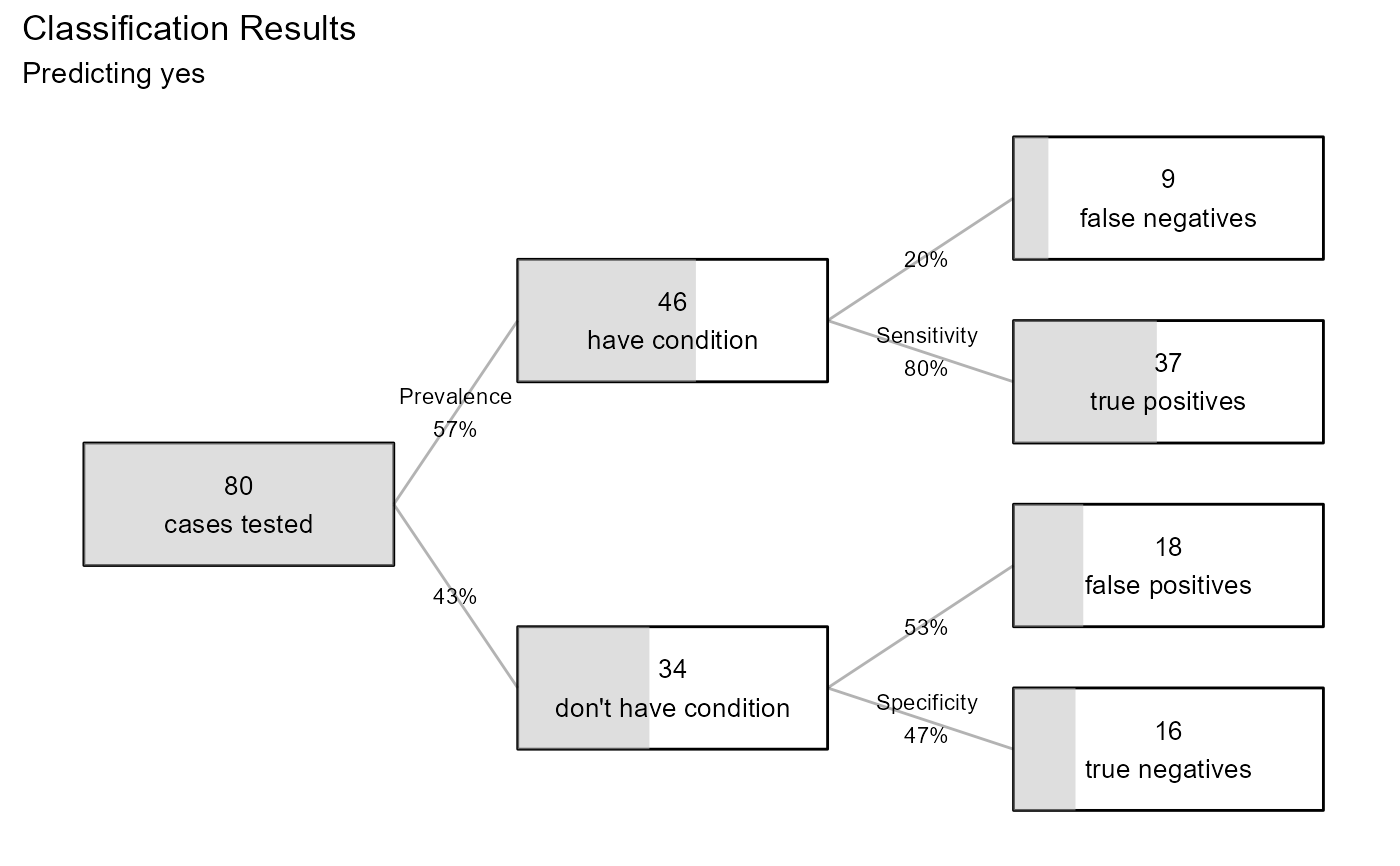
performance(fit2)
#> LOGISTIC REGRESSION PERFORMANCE
#> Data              : caesarian
#> N                 : 80
#> Response variable : caesarian
#> Category Balance  : no (0.42%) yes (0.58%)
#> Predicted category: yes
#> Prob to classify  : >=0.5
#>
#> Model: glm(caesarian ~ age + bp + delivery.time,
#>            family = binomial, data = caesarian)
#>
#> Confusion Matrix
#>
#>          Actual
#> Predicted no yes
#>       no  16   9
#>       yes 18  37
#>
#> Overall Statistics
#>
#> Accuracy: 0.6625
#> 97% CI  : (0.5481, 0.7645)
#> No Information Rate:  0.575
#> P-Value [Acc > NIR]:  0.06961
#>
#> Statistics by Category
#>
#> Sensitivity    0.8043
#> Specificity    0.4706
#> Pos Pred Value 0.6727
#> Neg Pred Value 0.6400
#> F1             0.7327
#> ---
#> Note: recall = sensitivity,
#>       precision = pos pred value.
