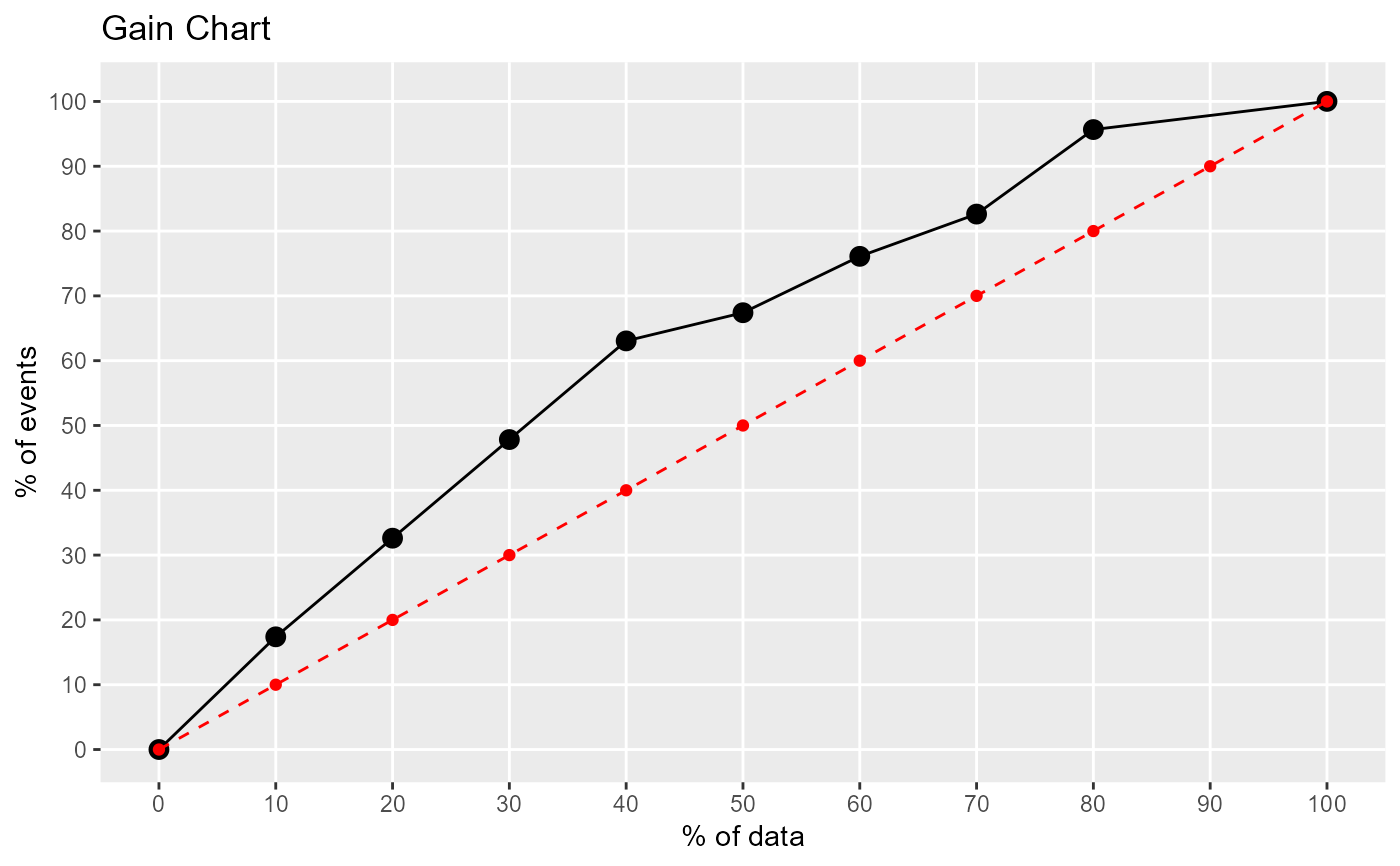
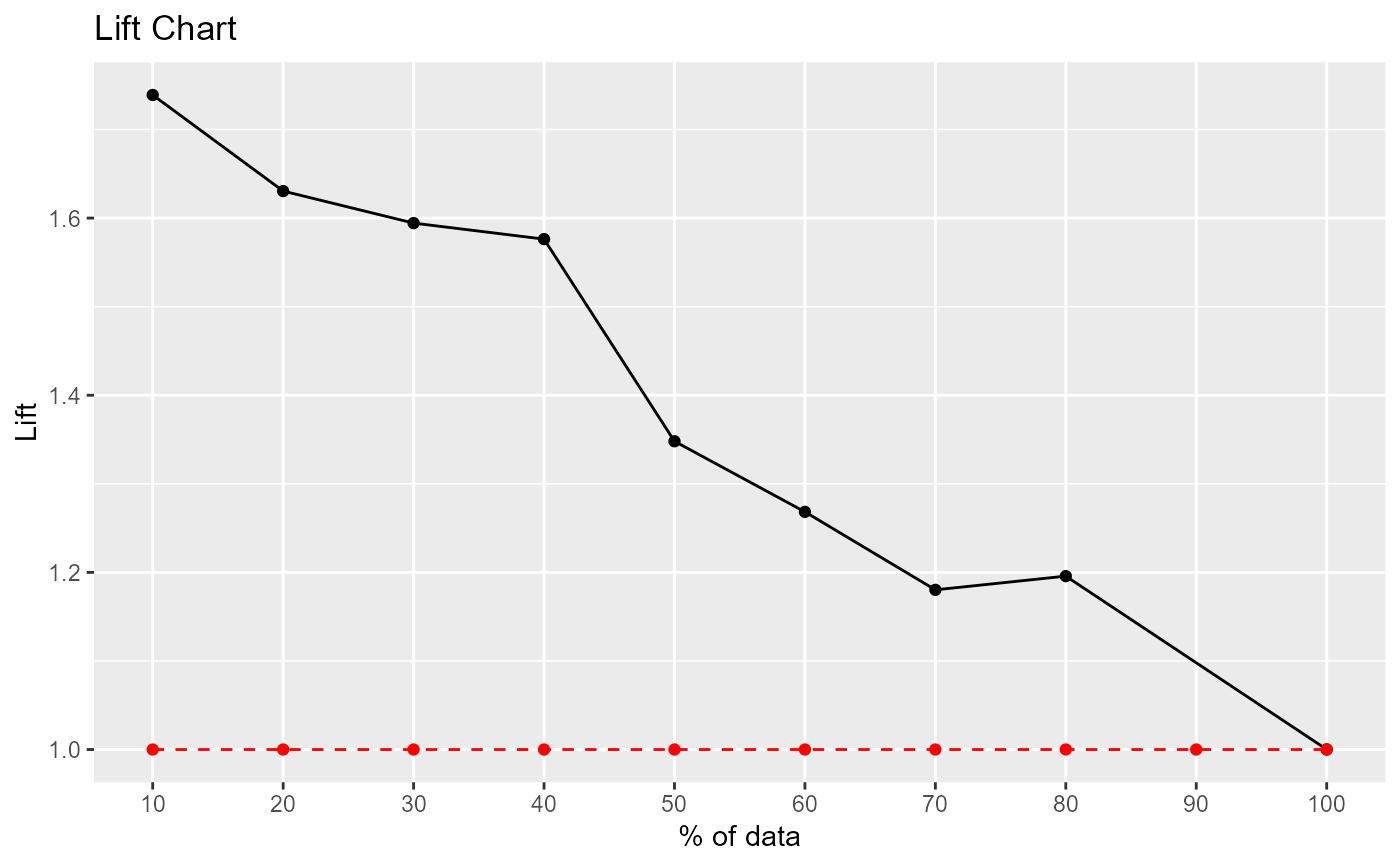
Lift and Gain Charts
lift_plot.RdCreate lift and gain charts for binary classification problems
lift_plot(actual, prob, positive = "yes")Arguments
- actual
actual class.
- prob
predicted probability of target class.
- positive
which class is the target class?
Value
a data frame with lift and gain values for each decile.
Examples
# logistic regression example
fit <- glm(caesarian ~ ., family=binomial, data = caesarian)
pred <- predict(fit, newdata=caesarian, type="response")
results <- lift_plot(caesarian$caesarian, pred, positive="yes")


print(results)
#>   decile ncases nresp cumresp pctevents   gain  cumlift
#> 1     10      8     8       8     17.39  17.39 1.739000
#> 3     20      8     7      15     15.22  32.61 1.630500
#> 4     30      8     7      22     15.22  47.83 1.594333
#> 5     40      8     7      29     15.22  63.05 1.576250
#> 6     50      8     2      31      4.35  67.40 1.348000
#> 7     60      8     4      35      8.70  76.10 1.268333
#> 8     70      8     3      38      6.52  82.62 1.180286
#> 9     80      8     6      44     13.04  95.66 1.195750
#> 2    100      8     2      46      4.35 100.01 1.000100