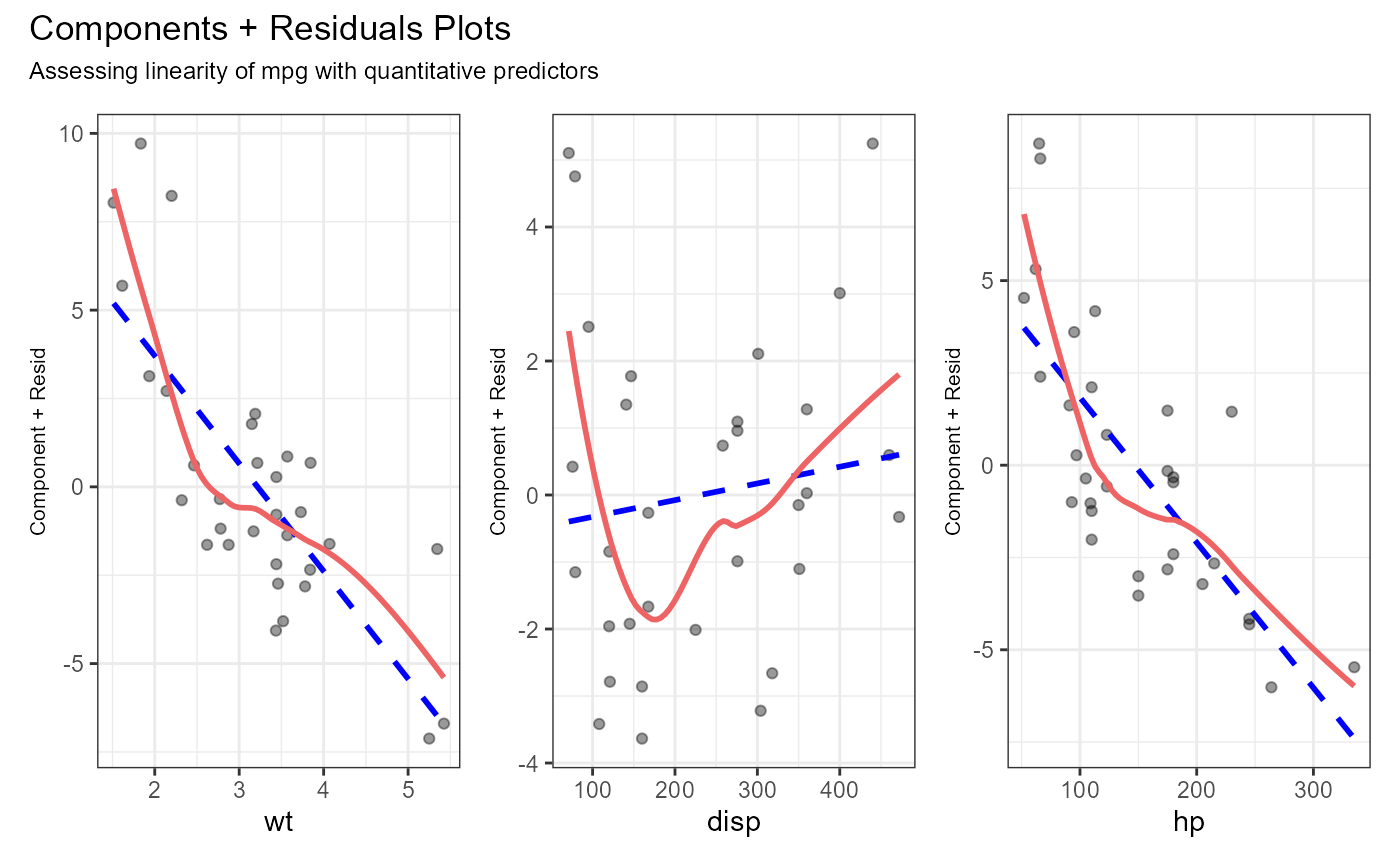
Component+Residual Plots
cr_plots.RdProduces component+residual (partial residual) plots for linear models.
cr_plots(x, alpha = 0.4, span = 0.75)Arguments
- x
an object of type
"lm".- alpha
numeric; degree of transparency for points (0 to 1, default=0.4)
- span
numeric; the degree of smoothing for loess lines (default=0.75)
Value
a ggplot2 graph
Details
This function is a modification of the crPlots function
in the car package, using ggplot2 rather than
base graphics.
Note
The linear model can contain factors but not interactions. Plots are based on all predictors, but only the numeric variables are plotted. Each plot has a linear and loess fit line.