Plots group means with error bars. Error bars can be standard deviations, standard errors, or confidence intervals. Optionally, plots can be based on robust statistics.
mean_plot(
  data,
  y,
  x,
  by,
  pointsize = 2,
  dodge = 0.2,
  lines = TRUE,
  width = 0.2,
  error_type = c("se", "sd", "ci"),
  percent = 0.95,
  robust = FALSE
)
Arguments
- data
a data frame.
- y
a numeric response variable.
- x
a categorical explanatory variable.
- by
a second categorical explanatory variable (optional).
- pointsize
numeric. Point size (default = 2).
- dodge
numeric. If a
byvariable is included, points and error bars are dodged by this amount in order to avoid overlap (default = 0.2).- lines
logical. If
TRUE, group means are connected.- width
numeric. Width of the error bars (default = 0.2). Set to 0 to produce pointranges instead of error bars.
- error_type
character. Error bars represents either standard deviations
(sd), standard errors of the means(se), or confidence intervals(ci). The default is the standard error.- percent
numeric. if
error_type = "ci", this indicates the size of the confidence interval. The default is0.95or a 95 percent confidence interval for the mean.- robust
logical. If
TRUE, the means, standard deviations, standard errors, and confidence intervals are based on robust statistics. SeeDetails. The default isFALSE.
Value
a ggplot2 graph.
Details
Robust statistics are based on deciles, the nine values that divide the response variable into 10 equal groups (where each group contains roughly the same fraction of cases). The robust mean is the mean of these nine decile values. The robust standard deviation is the sample standard deviation of the nine decile values. The standard error and confidence interval are calculated in the normal way, but use the robust mean and standard deviation in their calculations. See Abu-Shawiesh et al (2022).
References
Ahmed Abu-Shawiesh, M., Sinsomboonthong, J., & Kibria, B. (2022). A modified robust confidence interval for the population mean of distributrion baed on deciles. Statistics in Transition, vol. 23 (1). pdf
Examples
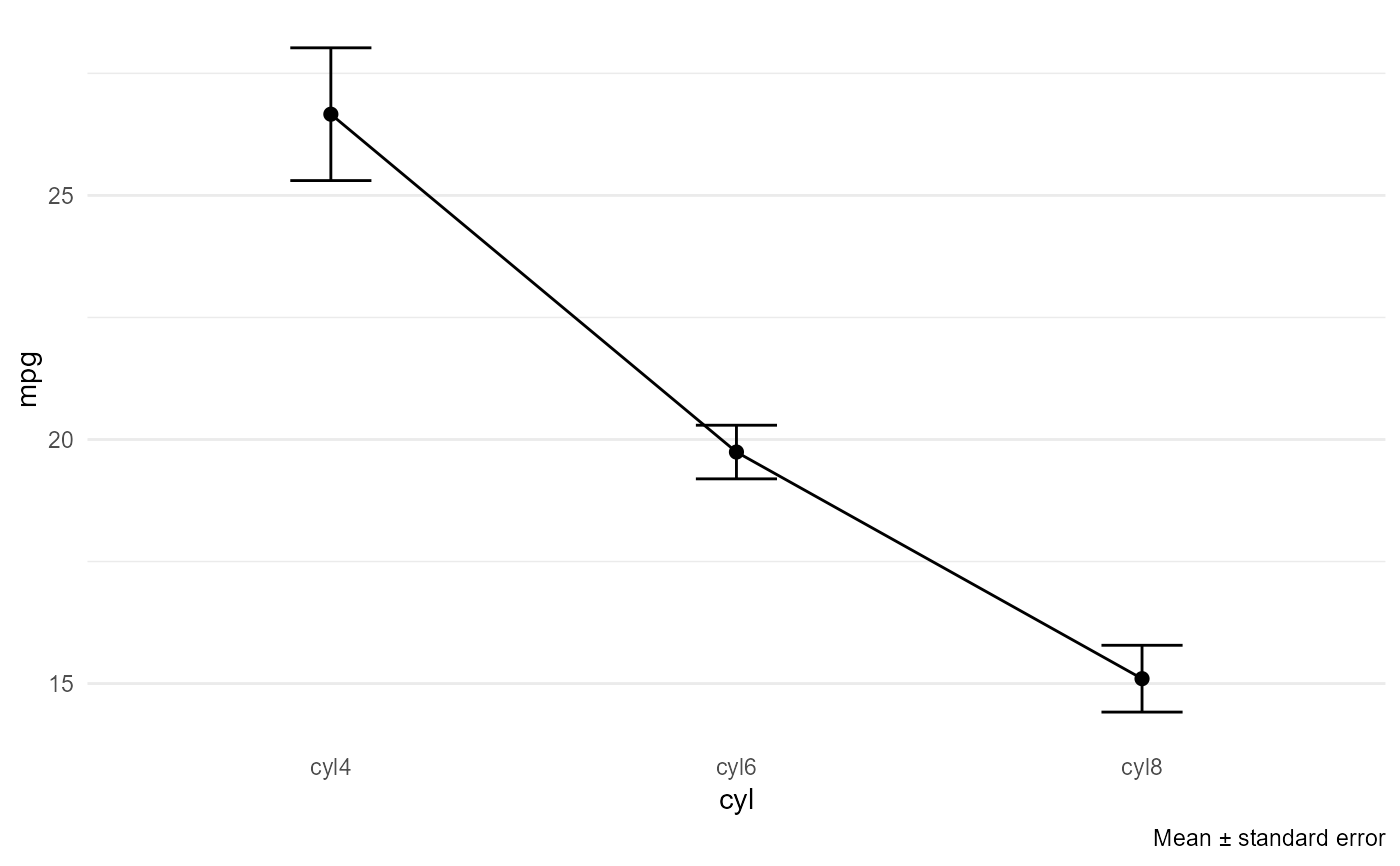
mean_plot(cars74, mpg, cyl)
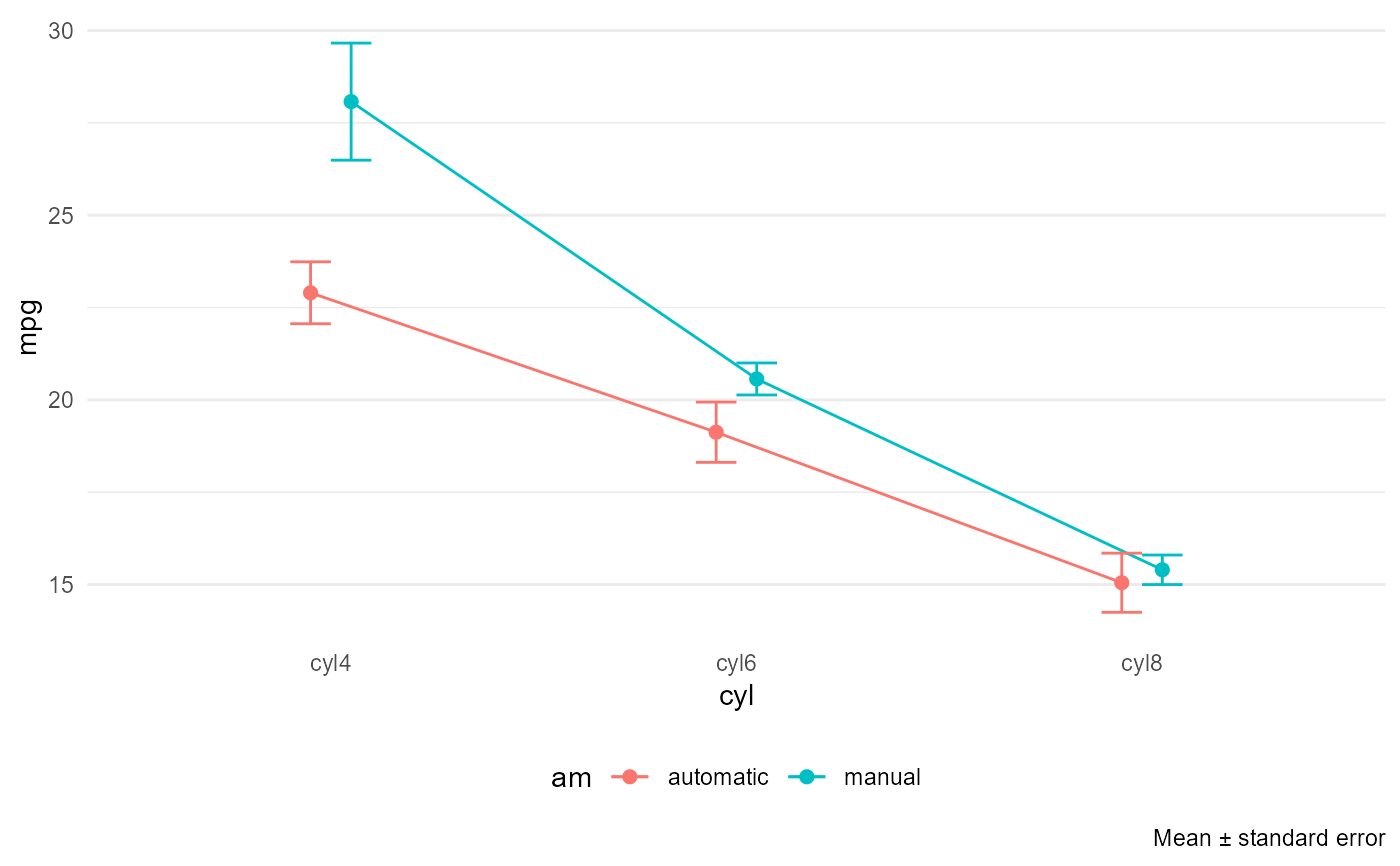
 mean_plot(cars74, mpg, cyl, am)
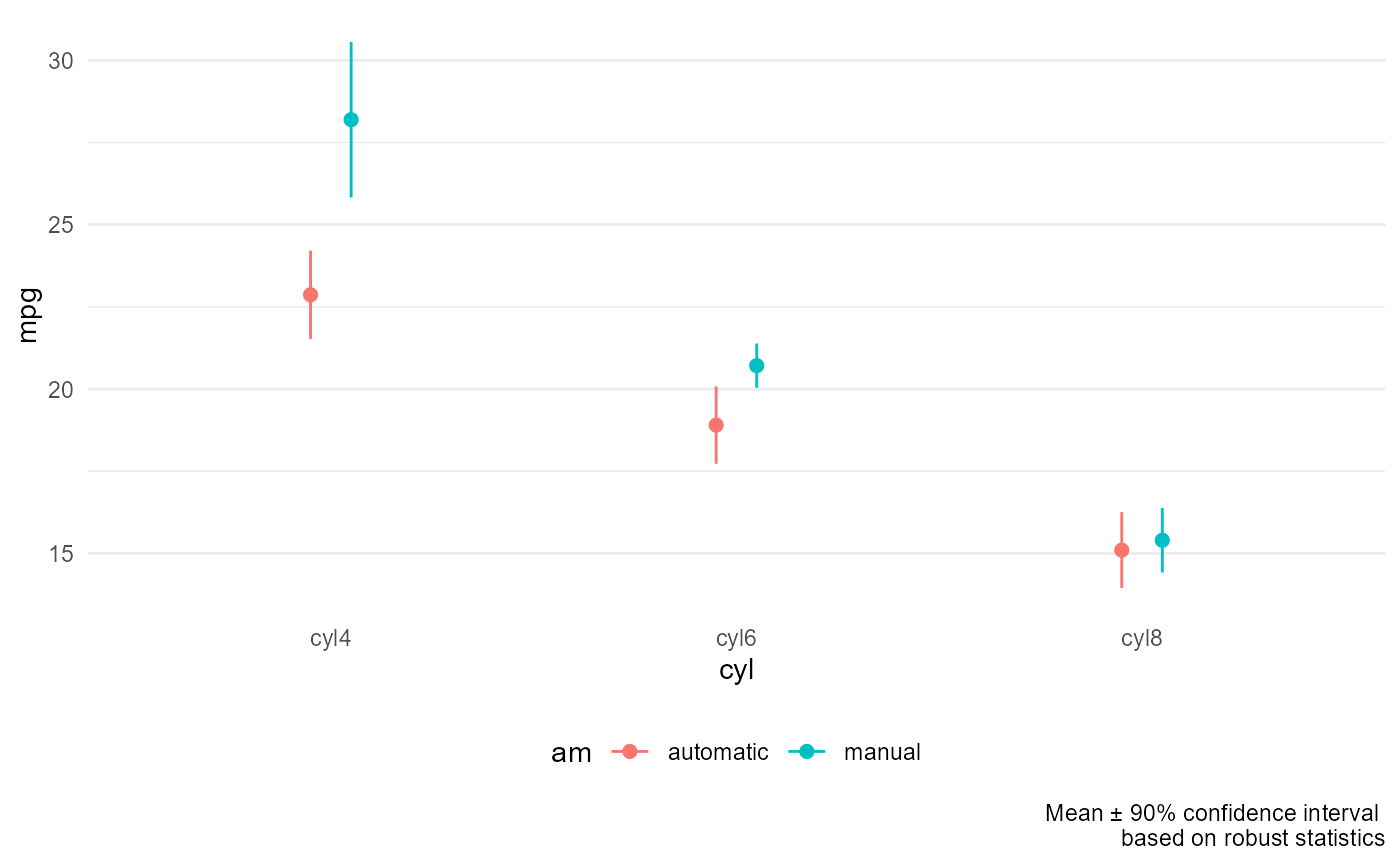
 mean_plot(cars74, mpg, cyl, am,
error_type = "ci", percent = 0.9,
width = 0, lines = FALSE, robust = TRUE)
mean_plot(cars74, mpg, cyl, am,
error_type = "ci", percent = 0.9,
width = 0, lines = FALSE, robust = TRUE)