Create histograms for all quantitative variables in a data frame.
histograms(data, fill = "deepskyblue2", color = "white", bins = 30)Arguments
- data
data frame
- fill
fill color for histogram bars
- color
border color for histogram bars
- bins
number of bins (bars) for the histograms
Value
a ggplot graph
Details
The histograms function will only plot quantitative variables from
a data frame. Categorical variables are ignored.
Examples
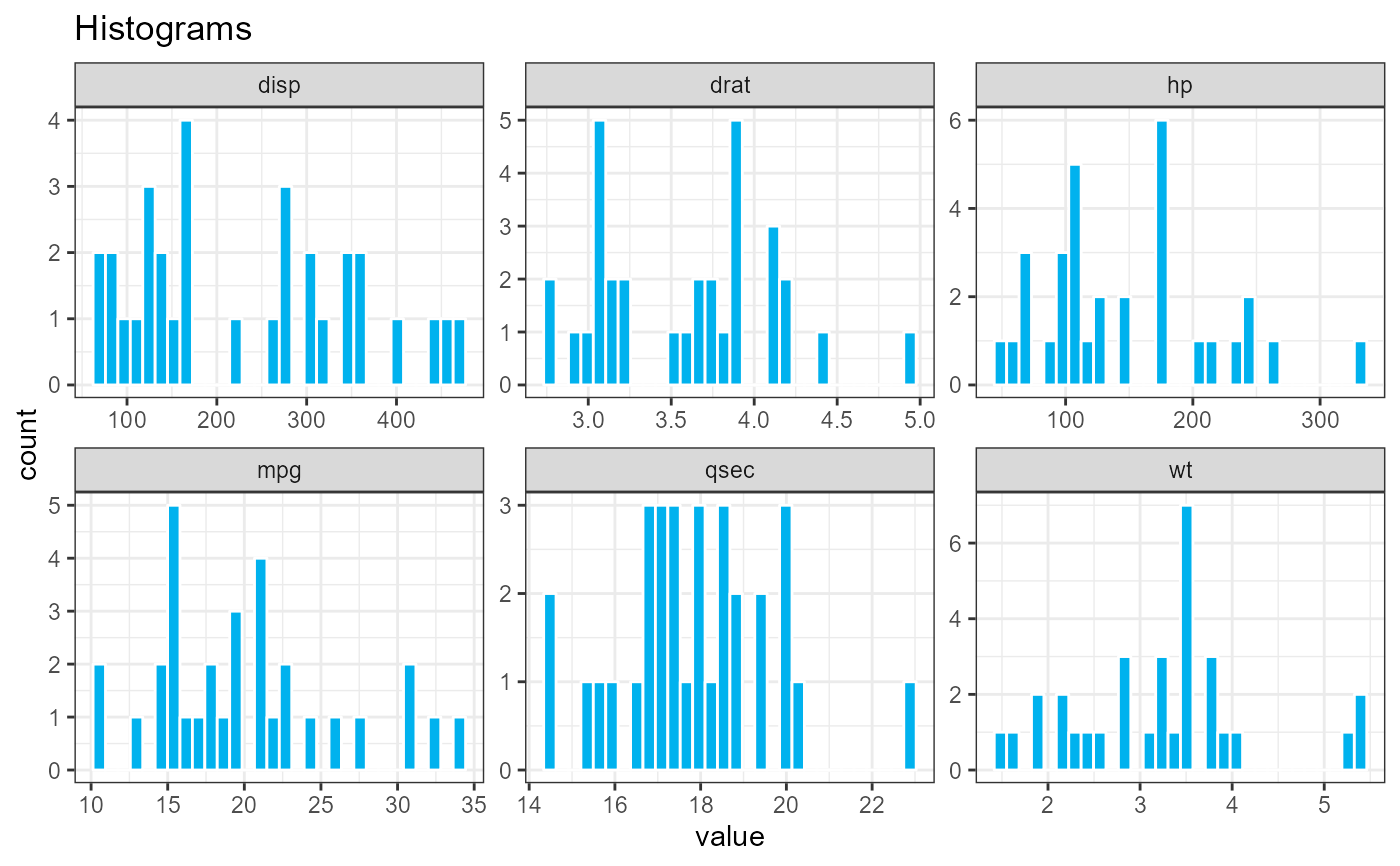
histograms(cars74)
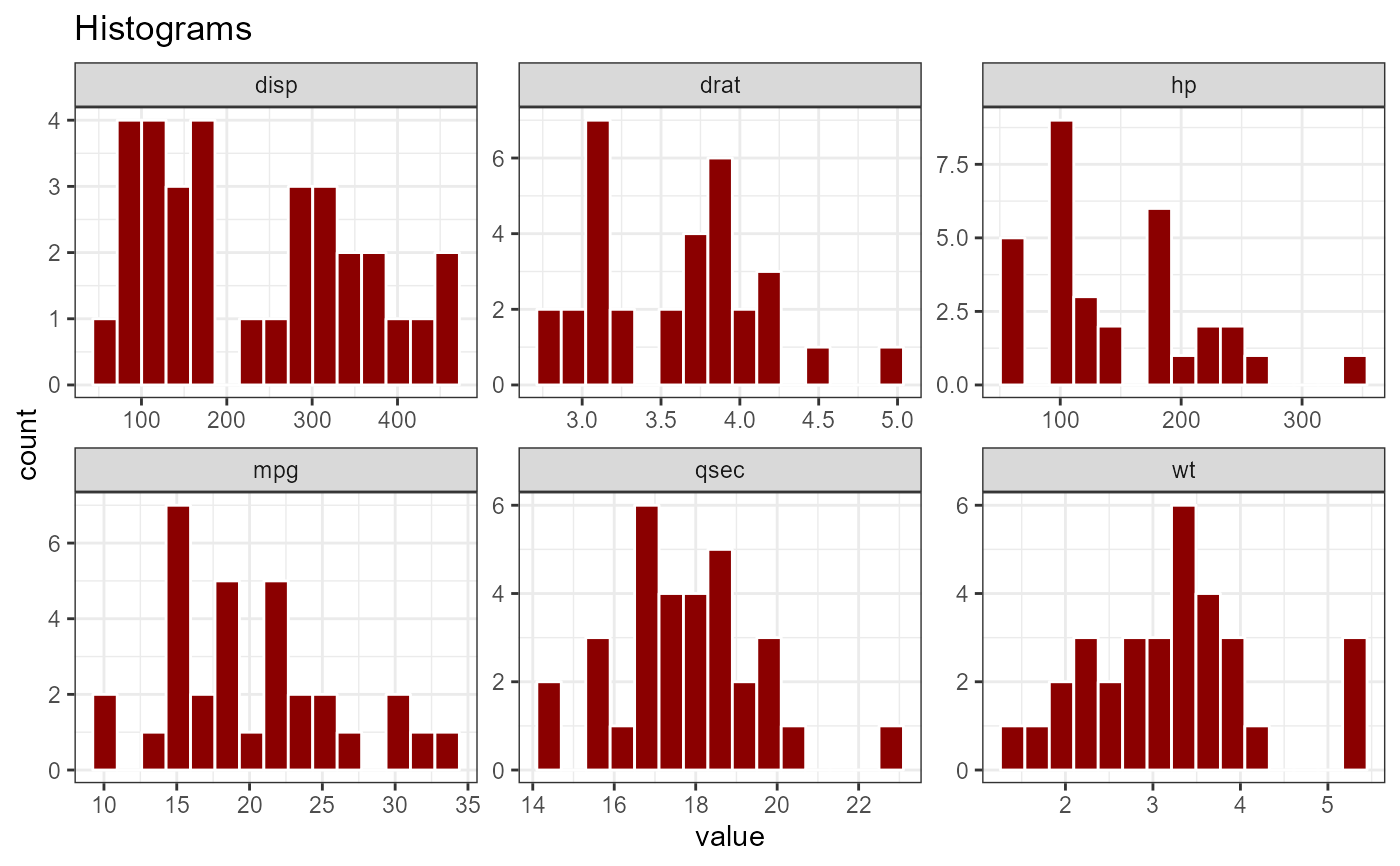
 histograms(cars74, bins=15, fill="darkred")