Create desnsity plots for all quantitative variables in a data frame.
densities(data, fill = "deepskyblue2", adjust = 1)Arguments
- data
data frame
- fill
fill color for density plots
- adjust
a factor multiplied by the smoothing bandwidth. See details.
Value
a ggplot graph
Details
The densities function will only plot quantitative variables from
a data frame. Categorical variables are ignored.
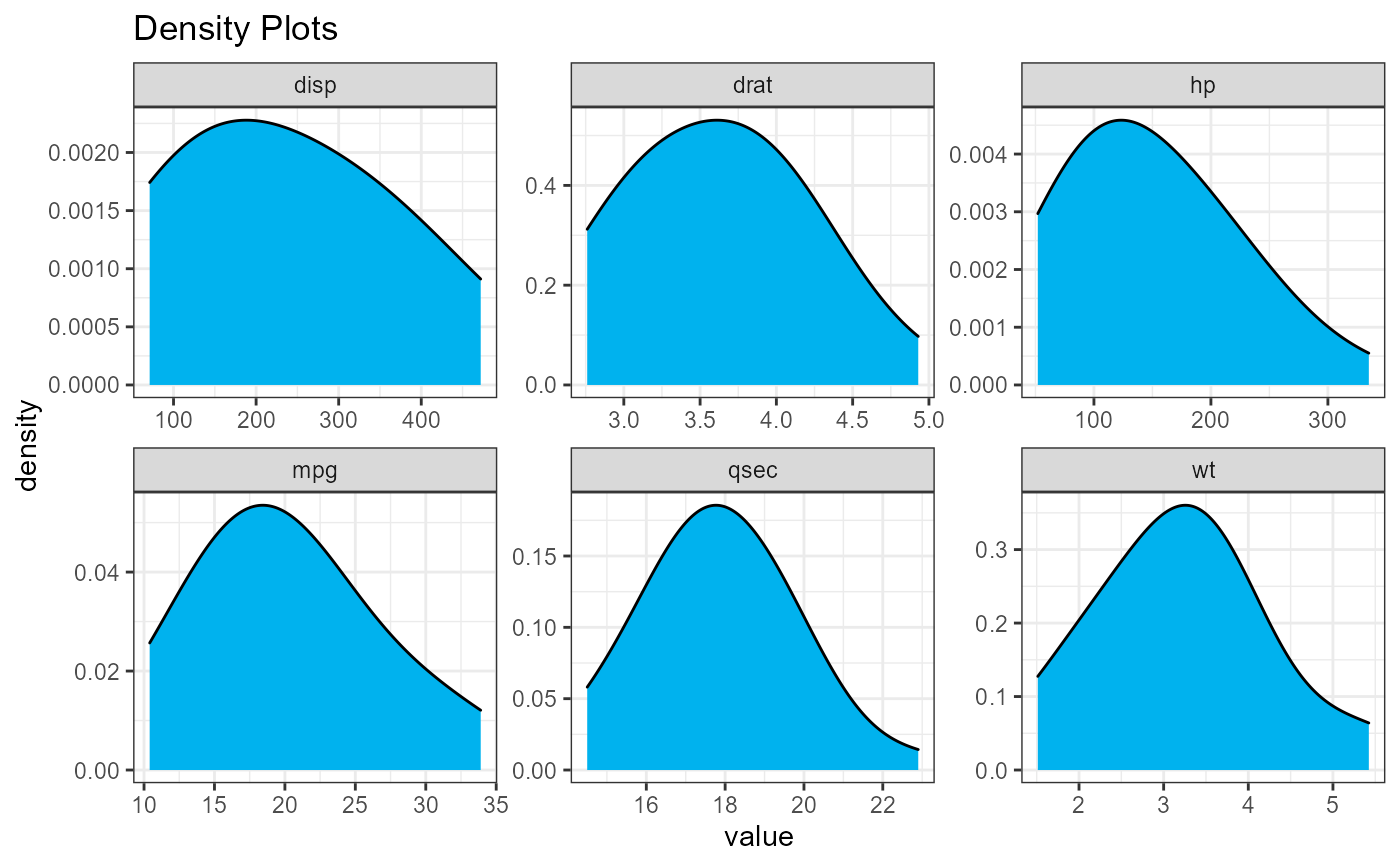
The adjust parameter mulitplies the smoothing parameter. For example
adjust = 2 will make the density plots twice as smooth.
The adjust = 1/2 will make the density plots half as smooth (i.e., twice as spiky).
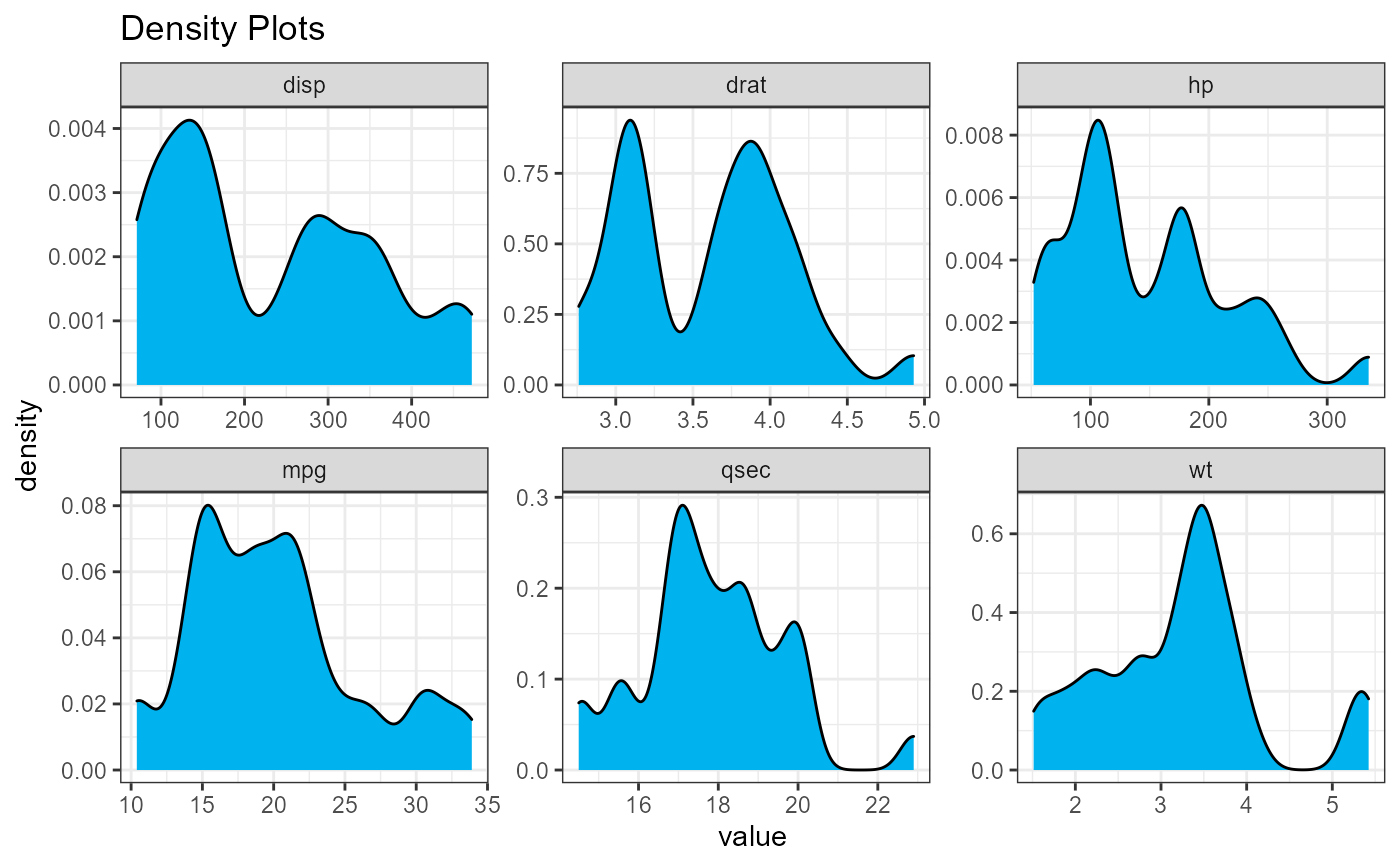
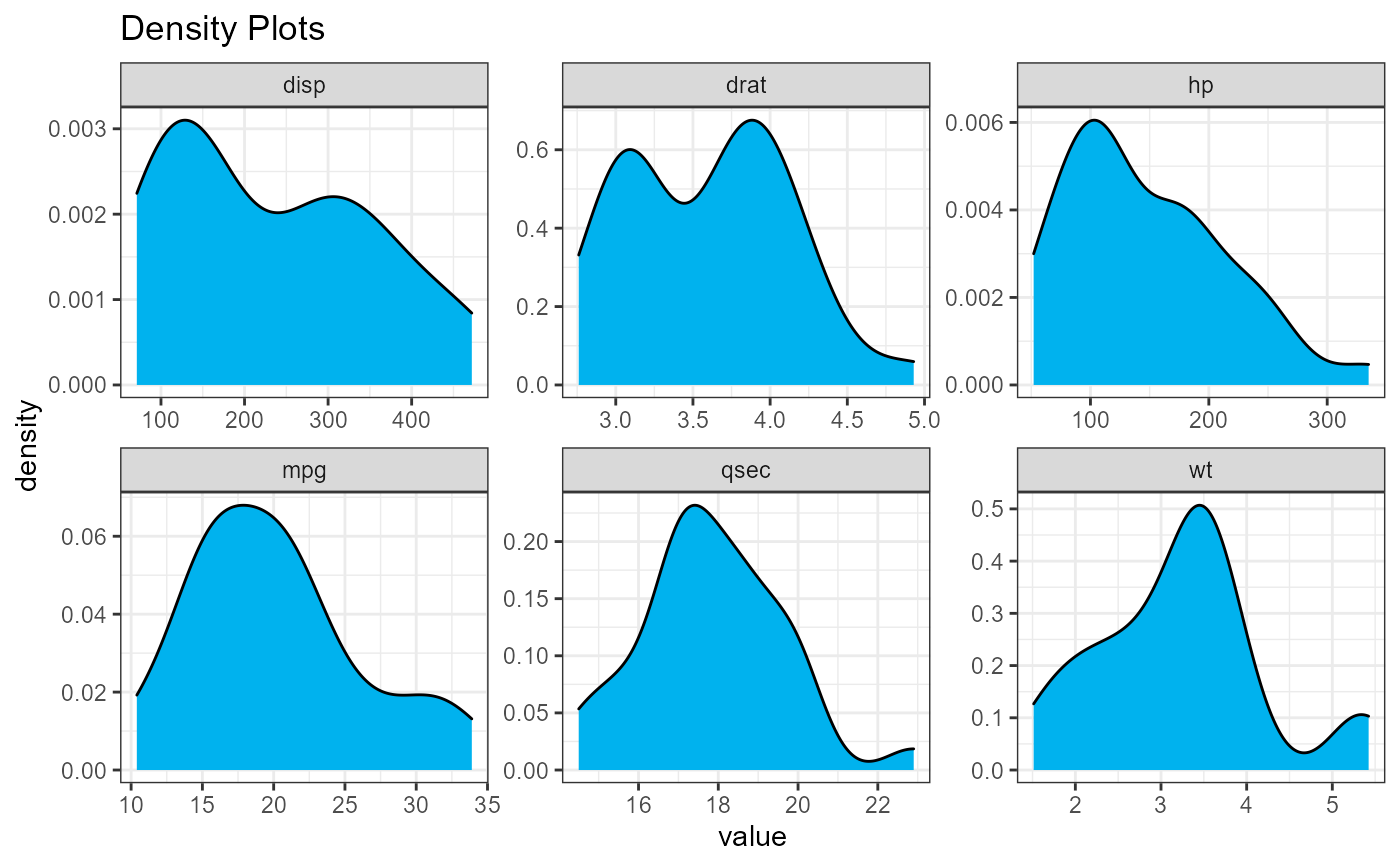
Examples
densities(cars74)


densities(cars74, adjust=2)


densities(cars74, adjust=1/2)