Create barcharts for all categorical variables in a data frame.
barcharts(
  data,
  fill = "deepskyblue2",
  color = "grey30",
  labels = TRUE,
  sort = TRUE,
  maxcat = 20,
  abbrev = 20
)
Arguments
- data
data frame
- fill
fill color for bars
- color
color for bar labels
- labels
if
TRUE, bars are labeled with percents- sort
if
TRUE, bars are sorted by frequency- maxcat
numeric. barcharts with more than this number of bars will not be plotted.
- abbrev
numeric. abbreviate bar labels to at most, this character length.
Value
a ggplot graph
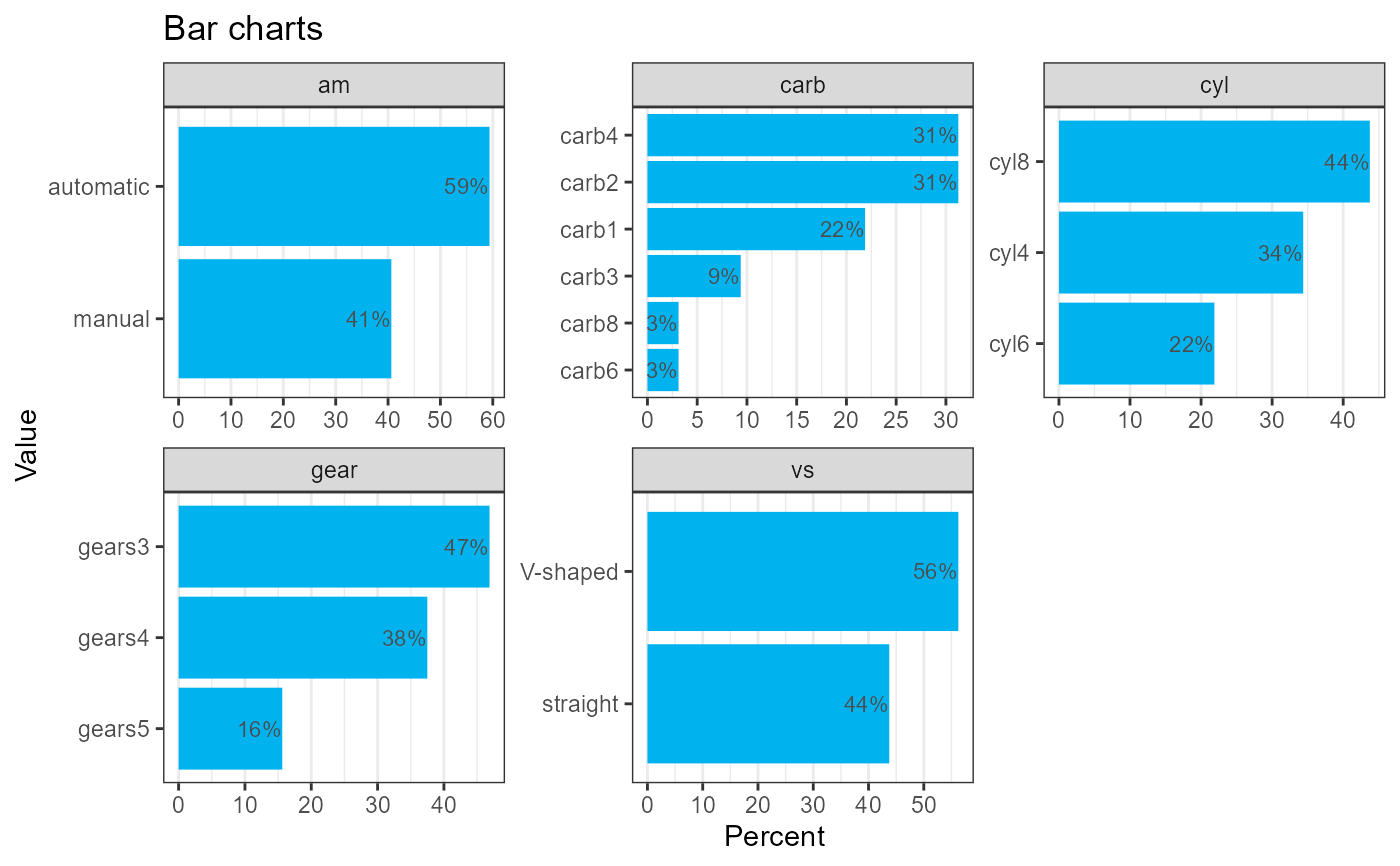
Examples
barcharts(cars74)
#> The following variable had more than 20 levels and were not graphed:
#>  auto