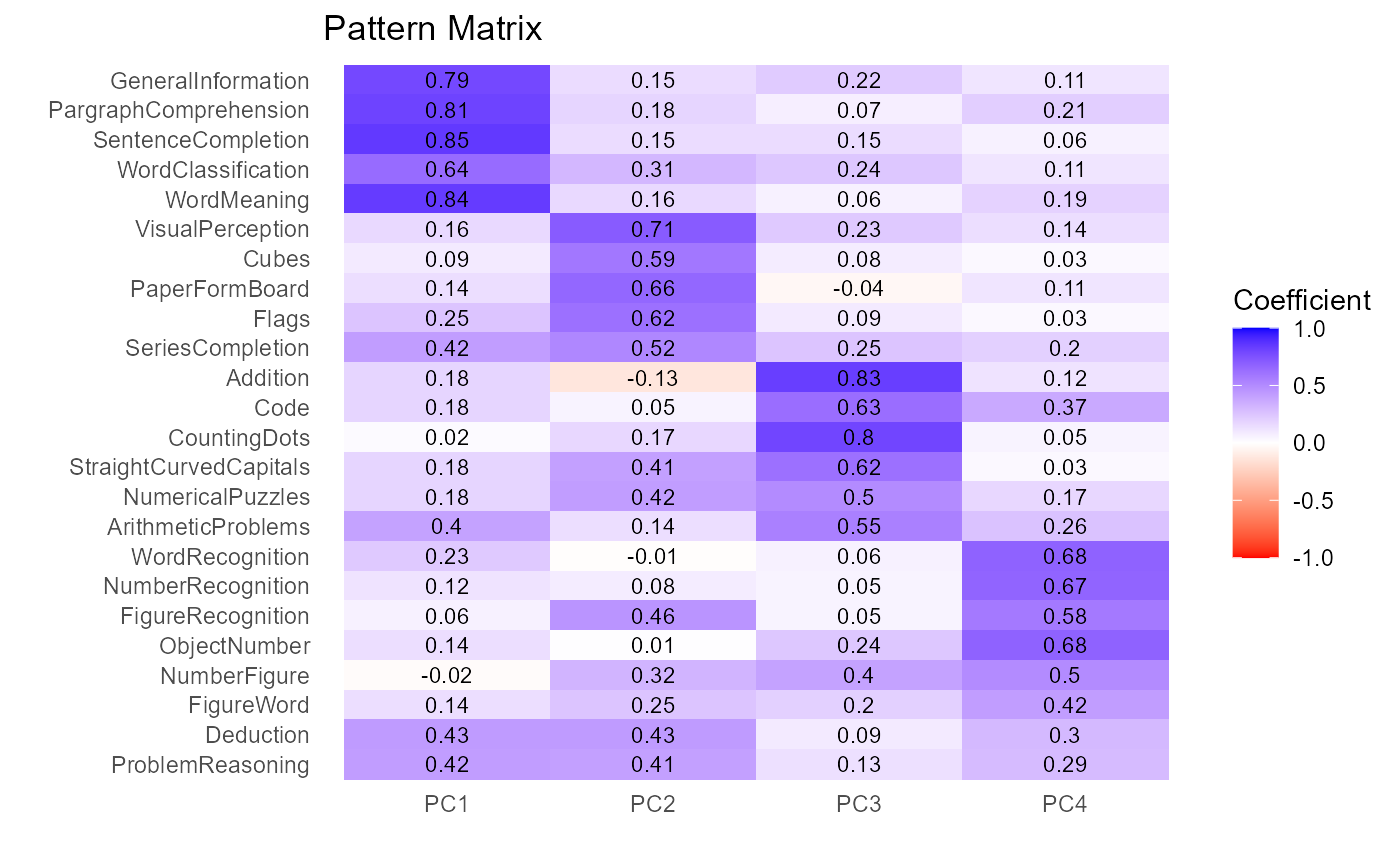
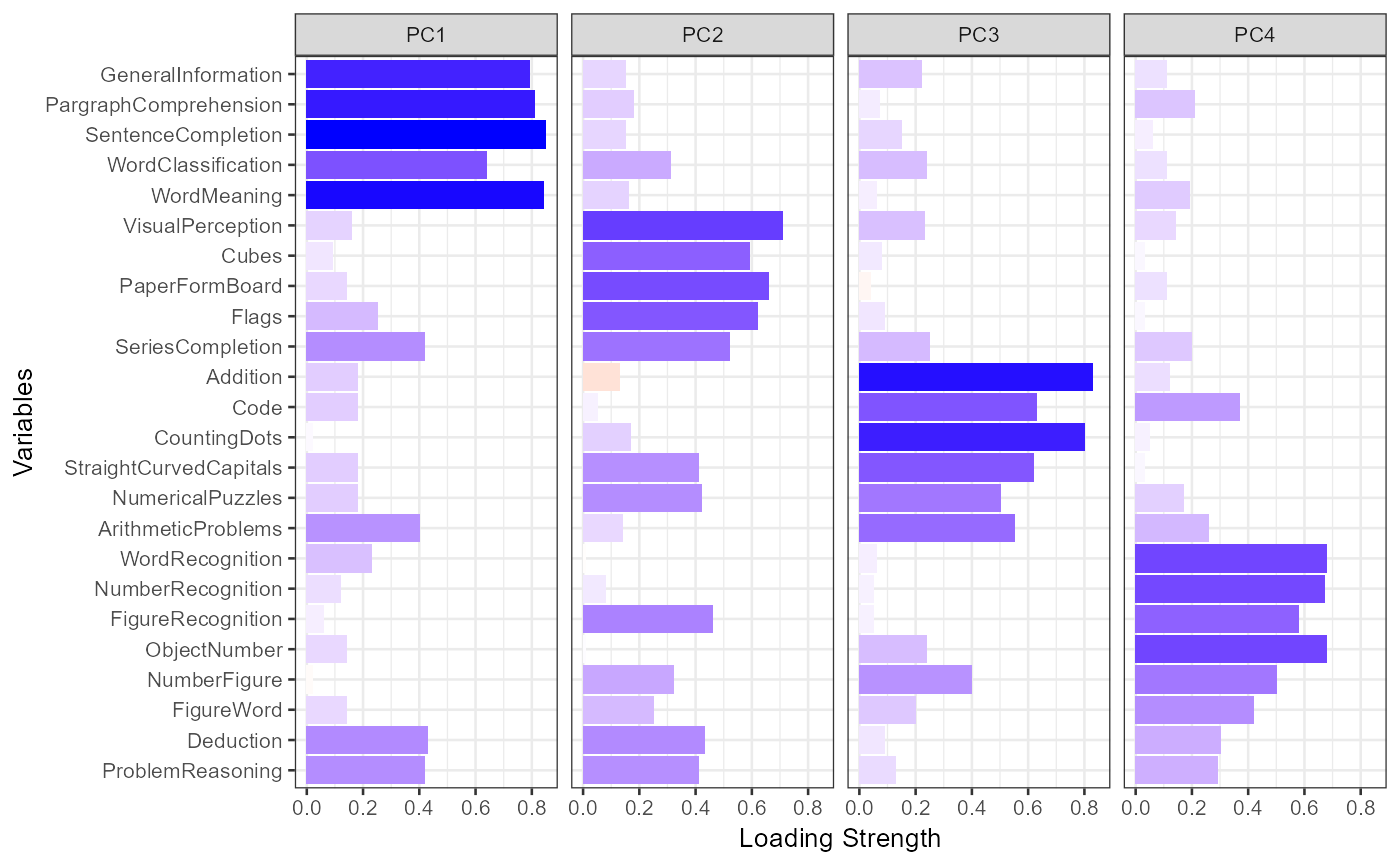
This function plots the pattern matrix for a principal components or common factor analysis solution
# S3 method for factorAnalysis
plot(x, sort = TRUE, type = c("table", "bar"), ...)
Arguments
| x | an object of class |
|---|---|
| sort | logical. If |
| type | generate a table plot ( |
| ... | not currently used |
Value
a ggplot2 graph
See also
Examples
#> #> Principal Components Analysis #> Number of Factors: 4 Rotation: varimax #> #> Component Structure #> PC1 PC2 PC3 PC4 h2 #> VisualPerception 0.16 0.71 0.23 0.14 0.60 #> Cubes 0.09 0.59 0.08 0.03 0.37 #> PaperFormBoard 0.14 0.66 -0.04 0.11 0.47 #> Flags 0.25 0.62 0.09 0.03 0.45 #> GeneralInformation 0.79 0.15 0.22 0.11 0.70 #> PargraphComprehension 0.81 0.18 0.07 0.21 0.73 #> SentenceCompletion 0.85 0.15 0.15 0.06 0.77 #> WordClassification 0.64 0.31 0.24 0.11 0.57 #> WordMeaning 0.84 0.16 0.06 0.19 0.78 #> Addition 0.18 -0.13 0.83 0.12 0.76 #> Code 0.18 0.05 0.63 0.37 0.57 #> CountingDots 0.02 0.17 0.80 0.05 0.67 #> StraightCurvedCapitals 0.18 0.41 0.62 0.03 0.59 #> WordRecognition 0.23 -0.01 0.06 0.68 0.52 #> NumberRecognition 0.12 0.08 0.05 0.67 0.48 #> FigureRecognition 0.06 0.46 0.05 0.58 0.55 #> ObjectNumber 0.14 0.01 0.24 0.68 0.54 #> NumberFigure -0.02 0.32 0.40 0.50 0.51 #> FigureWord 0.14 0.25 0.20 0.42 0.30 #> Deduction 0.43 0.43 0.09 0.30 0.47 #> NumericalPuzzles 0.18 0.42 0.50 0.17 0.49 #> ProblemReasoning 0.42 0.41 0.13 0.29 0.45 #> SeriesCompletion 0.42 0.52 0.25 0.20 0.55 #> ArithmeticProblems 0.40 0.14 0.55 0.26 0.55 #> #> PC1 PC2 PC3 PC4 #> Variance 4.16 3.31 3.22 2.74 #> Var Explained 0.17 0.14 0.13 0.11 #> Cum Var Explained 0.17 0.31 0.45 0.56