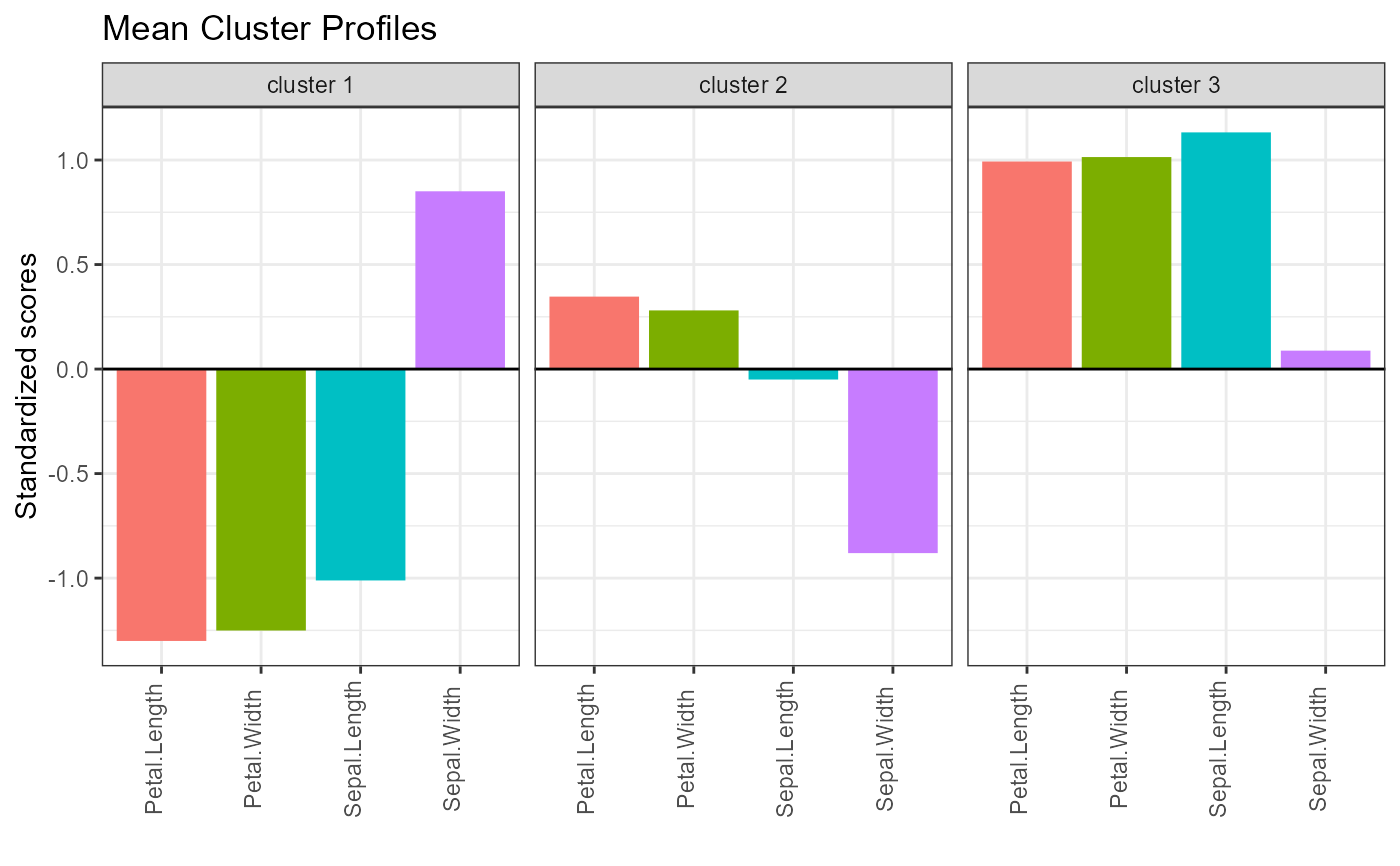
profile_plot generates a mean profile plot for each cluster in
a cluster analysis.
profile_plot(data, cluster = "cluster", type = c("bar", "line"))Arguments
- data
a data frame.
- cluster
variable containing cluster membership.
- type
character.
"bar"or"line"plots.
Value
a ggplot2 graph
Details
The data frame must contain numeric variables for all variables except the cluster variable. The cluster variable can be numeric, character, or factor. The data will be standardized before plotting. The bar charts are faceted, while the line charts are grouped.
Examples
# 3 cluster solution
iris <- standardize(iris)
df <- iris[-5]
set.seed(1234)
fit <- kmeans(df, 3)
df$cluster <- fit$cluster
profile_plot(df, type="bar")

profile_plot(df, type="line")
