df_plot visualizes the variables in a data frame.
df_plot(data)
Arguments
| data | a data frame. |
|---|
Value
a ggplot2 graph
Details
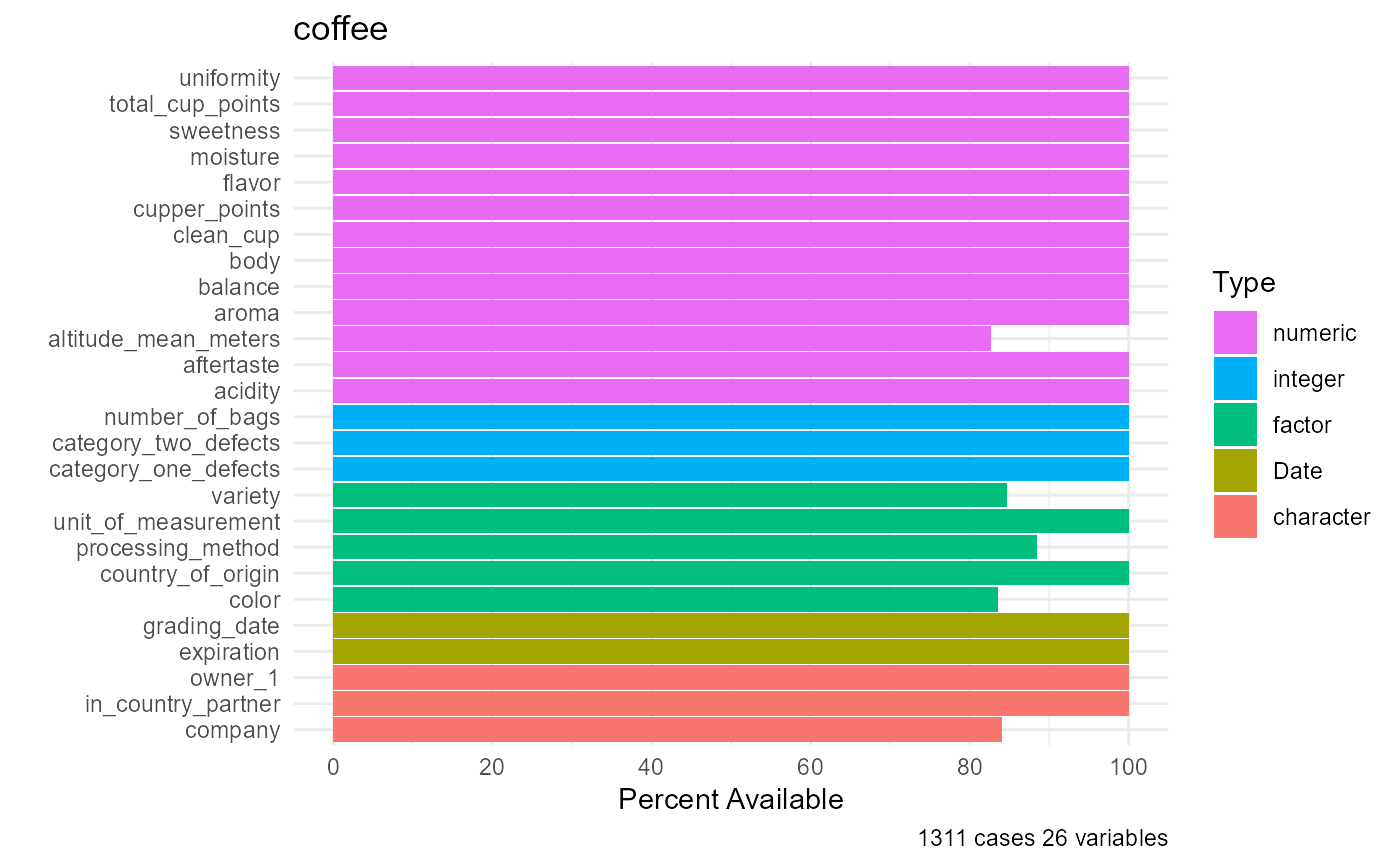
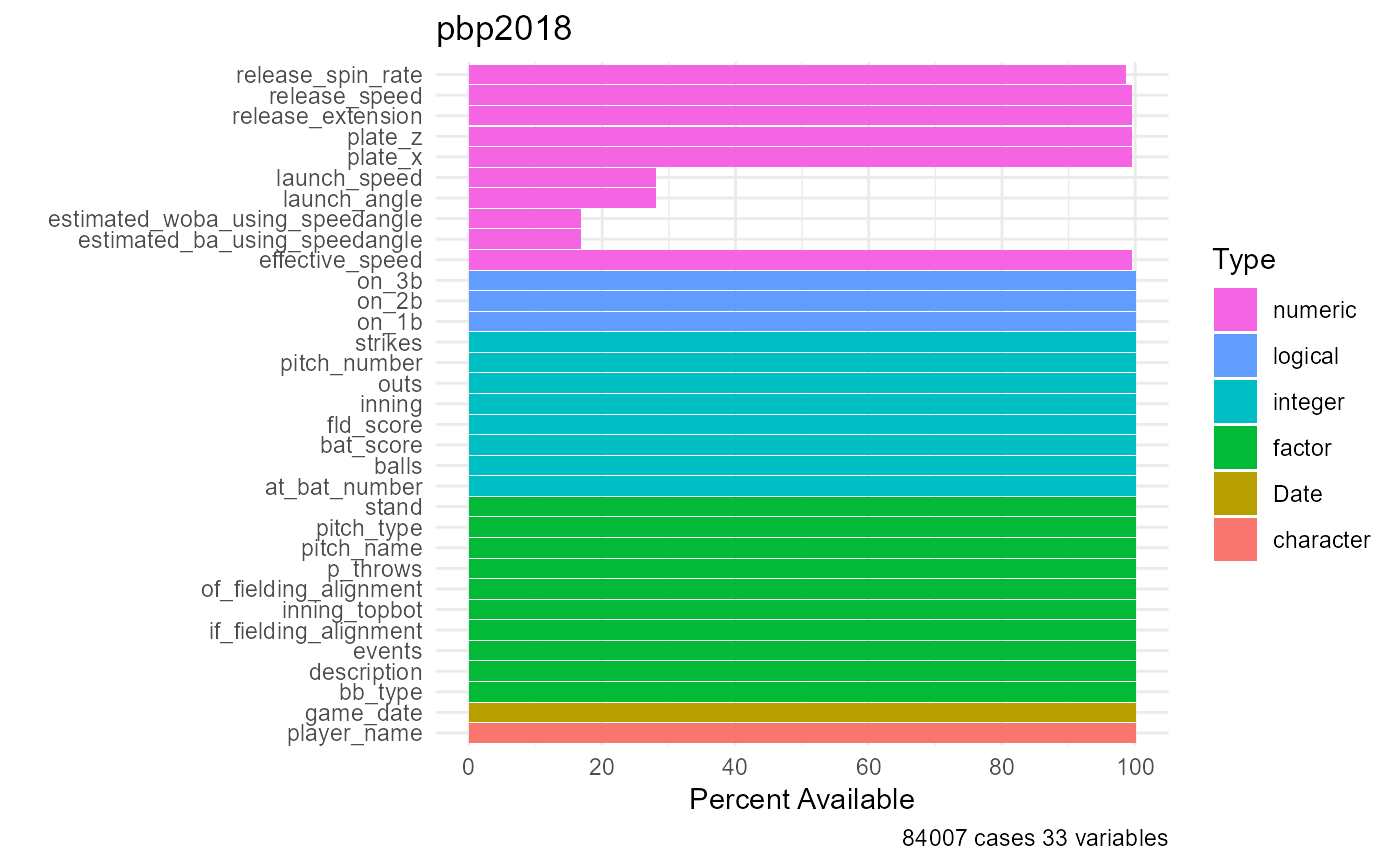
For each variable, the plot displays
type (
numeric,integer,factor,ordered factor,logical, ordate)percent of available (and missing) cases
Variables are sorted by type and the total number of variables and cases are printed in the caption.
See also
For more descriptive statistics on a data frame see contents.
Examples
df_plot(coffee)df_plot(pbp2018)