This function creates a two way frequency table.
crosstab(
  data,
  rowvar,
  colvar,
  type = c("freq", "percent", "rowpercent", "colpercent"),
  total = TRUE,
  na.rm = TRUE,
  digits = 2,
  chisquare = FALSE,
  plot = FALSE
)
Arguments
| data | data frame |
|---|---|
| rowvar | row factor (unquoted) |
| colvar | column factor (unquoted) |
| type | statistics to print. Options are |
| total | logical. if TRUE, includes total percents. |
| na.rm | logical. if TRUE, deletes cases with missing values. |
| digits | number of decimal digits to report for percents. |
| chisquare | logical. If |
| plot | logical. If |
Value
If plot=TRUE, return a ggplot2 graph.
Otherwise the function return a list with 6 components:
table(table). Table of frequencies or percentstype(character). Type of table to printtotal(logical). IfTRUE, print row and or column totalsdigits(numeric). number of digits to printrowname(character). Row variable namecolname(character). Column variable namechisquare(character). Ifchisquare=TRUE, contains the results of the Chi-square test.NULLotherwise.
Details
Given a data frame, a row factor, a column factor, and a type (frequencies, cell percents, row percents, or column percents) the function provides the requested cross-tabulation.
If na.rm = FALSE, a level labeled <NA> added. If
total = TRUE, a level labeled Total is added. If
chisquare = TRUE, a chi-square test of independence is
performed.
See also
Examples
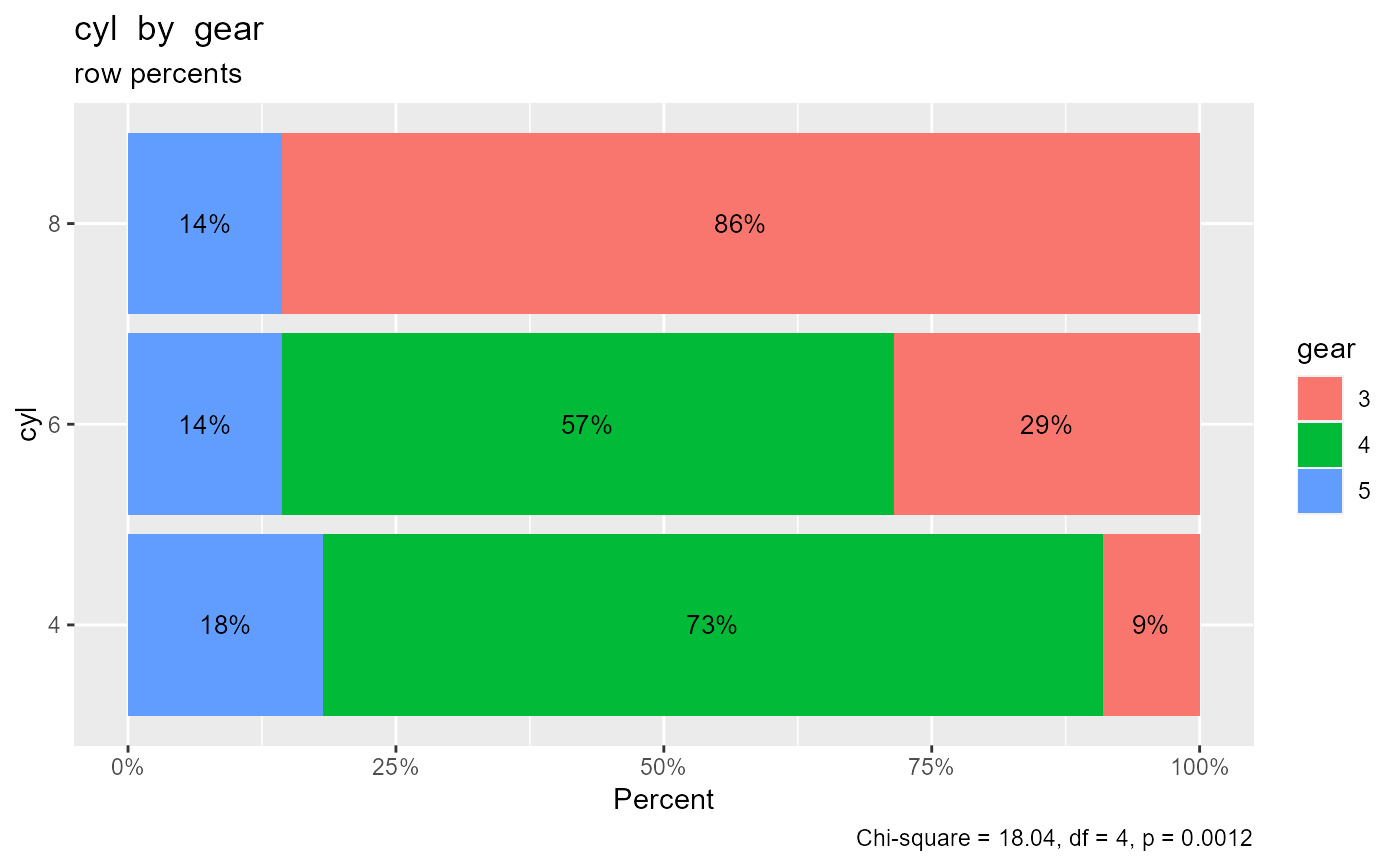
# print frequencies crosstab(mtcars, cyl, gear)#> gear #> cyl 3 4 5 Total #> 4 1 8 2 11 #> 6 2 4 1 7 #> 8 12 0 2 14 #> Total 15 12 5 32# print cell percents crosstab(mtcars, cyl, gear, type="percent")#> gear #> cyl 3 4 5 Total #> 4 3.12% 25.00% 6.25% 34.38% #> 6 6.25% 12.50% 3.12% 21.88% #> 8 37.50% 0.00% 6.25% 43.75% #> Total 46.88% 37.50% 15.62% 100.00%# print column percents with chi-square test crosstab(mtcars, cyl, gear, type="colpercent", chisquare=TRUE)#> gear #> cyl 3 4 5 #> 4 6.67% 66.67% 40.00% #> 6 13.33% 33.33% 20.00% #> 8 80.00% 0.00% 40.00% #> Total 100.00% 100.00% 100.00% #> #> Chi-square = 18.04, df = 4, p = 0.0012# plot row percents with chi-square test crosstab(mtcars, cyl, gear, type="rowpercent", plot=TRUE, chisquare=TRUE)