Create a correlation matrix for all quantitative variables in a data frame.
corplot(data, sort = FALSE, lab_size = 4)
Arguments
| data | data frame |
|---|---|
| sort | logical. If |
| lab_size | size for correlation coefficient labels (default=4). |
Value
a ggplot graph
Details
The corplot function will only select quantitative variables from
a data frame. Categorical variables are ignored.
The correlation matrix is presented as a lower triangle matrix. Correlations are Pearson Product Moment correlation coefficients.
Missing values are deleted in listwise fashion.
Note
This function is a wrapper for the ggcorrplot function.
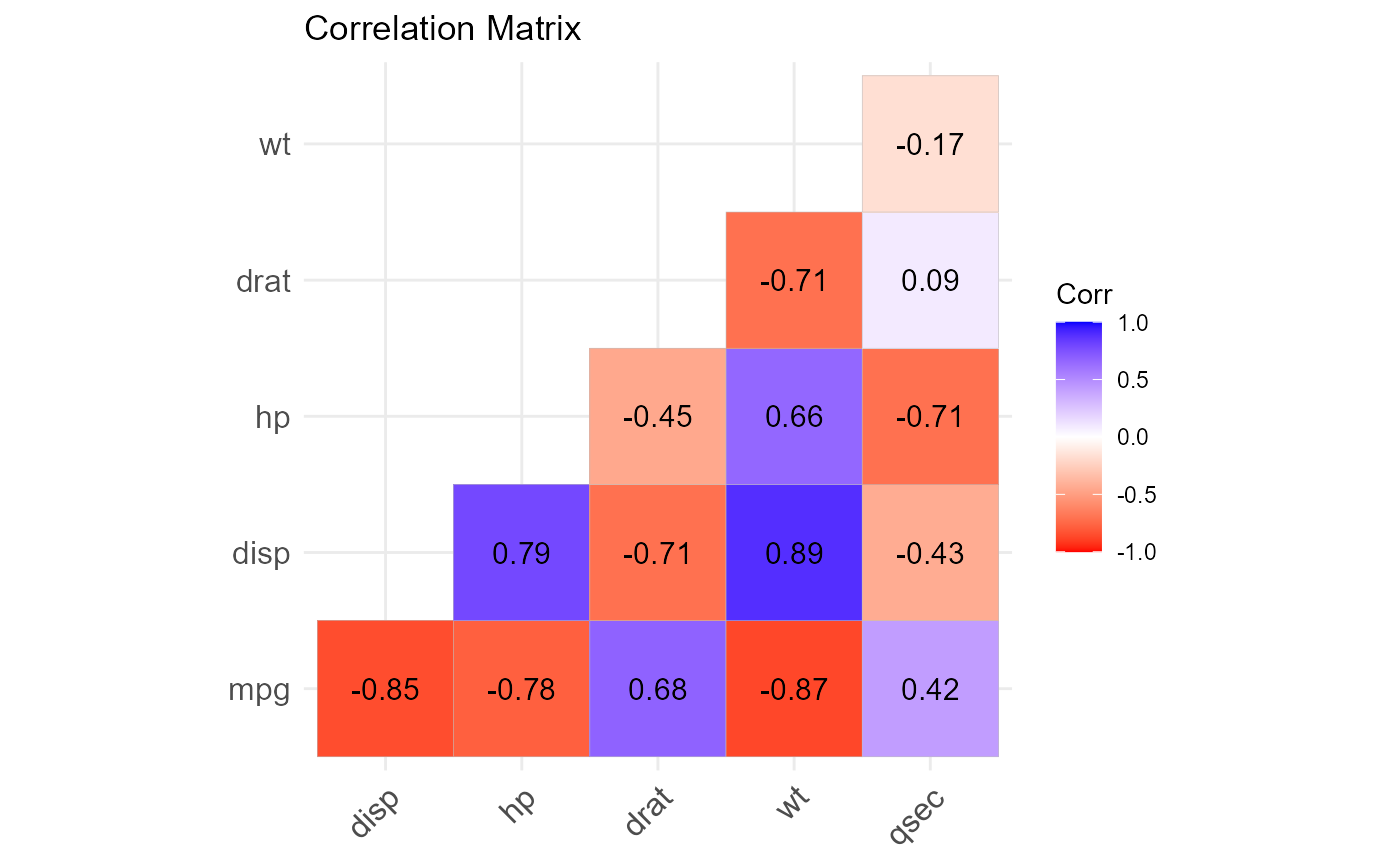
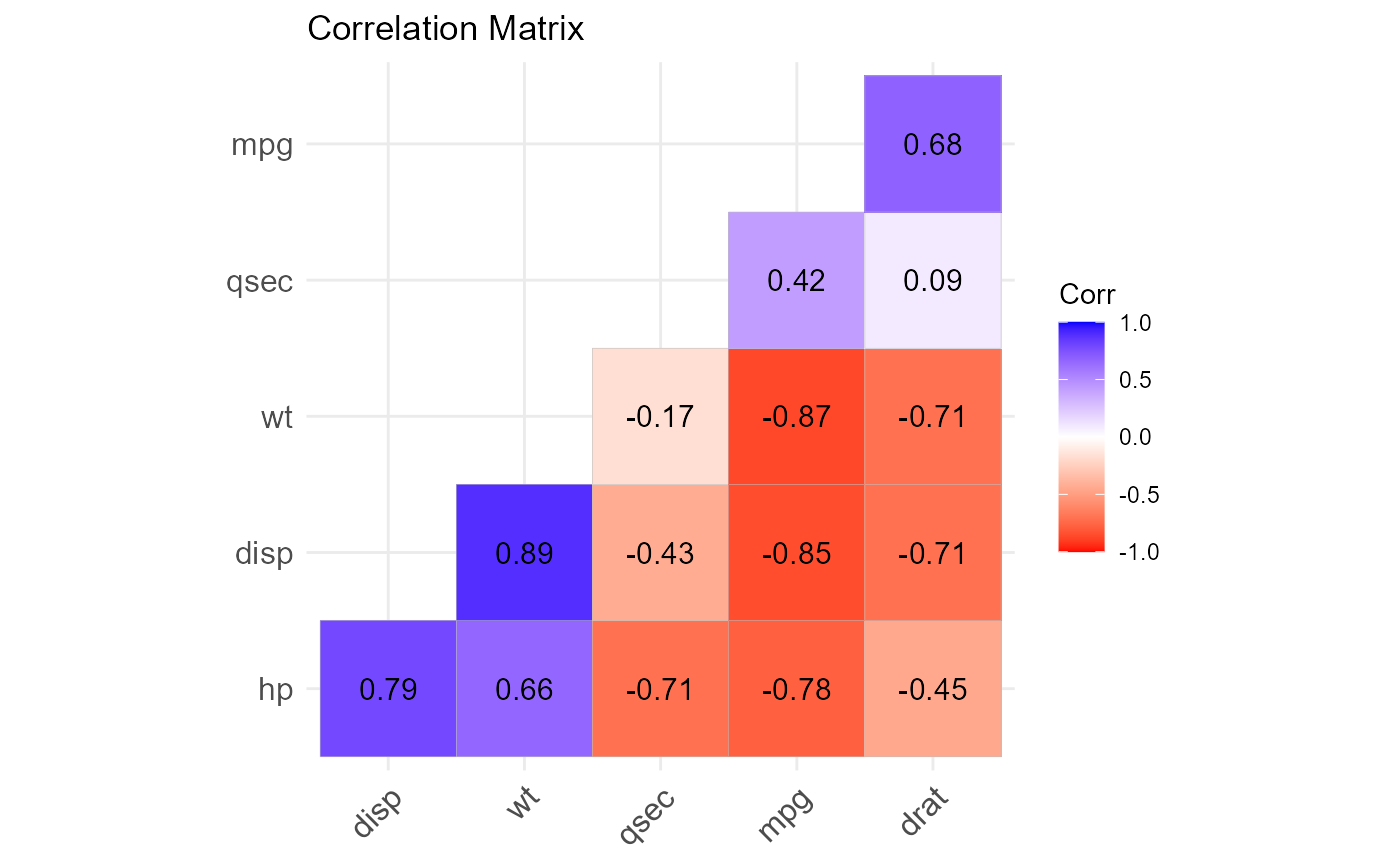
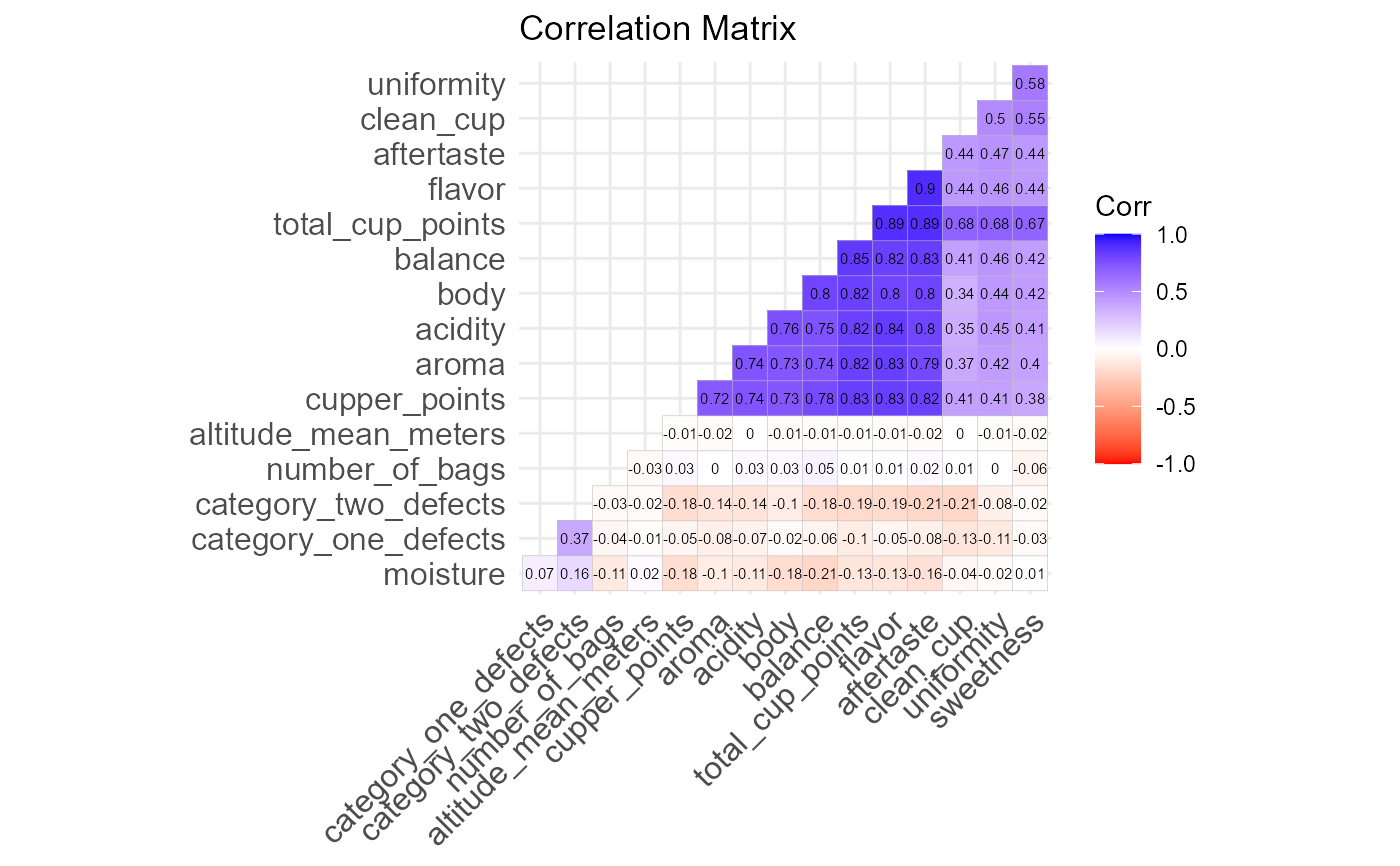
Examples
corplot(cars74)corplot(cars74, sort=TRUE)corplot(coffee, lab_size=2, sort=TRUE)