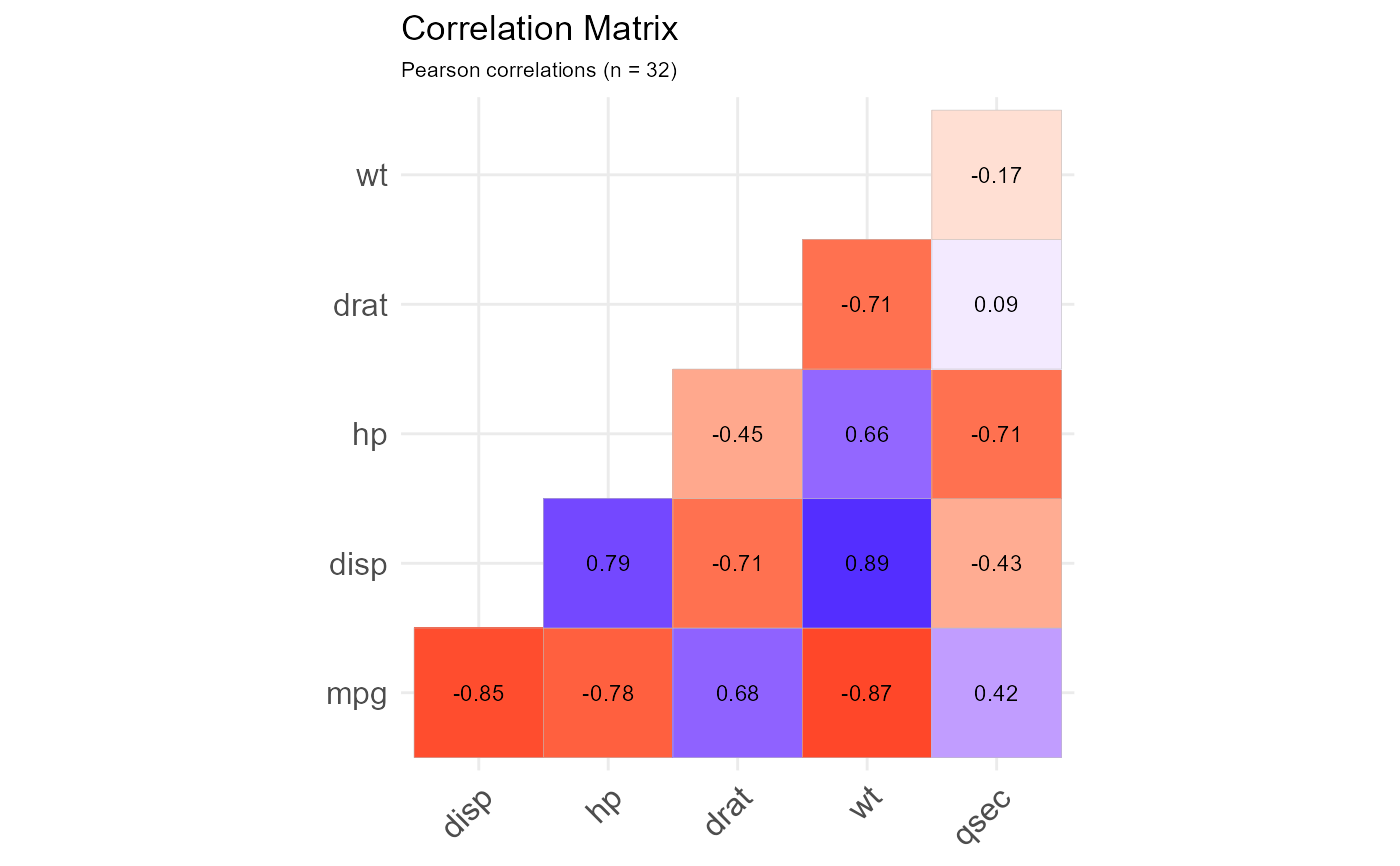
Create a correlation matrix for all quantitative variables in a data frame.
cor_plot(
  data,
  method = c("pearson", "kendall", "spearman"),
  sort = FALSE,
  axis_text_size = 12,
  number_text_size = 3,
  legend = FALSE
)
Arguments
| data | data frame |
|---|---|
| method | a character string indicating which correlation coefficient is to be computed. One of "pearson" (default), "kendall", or "spearman". |
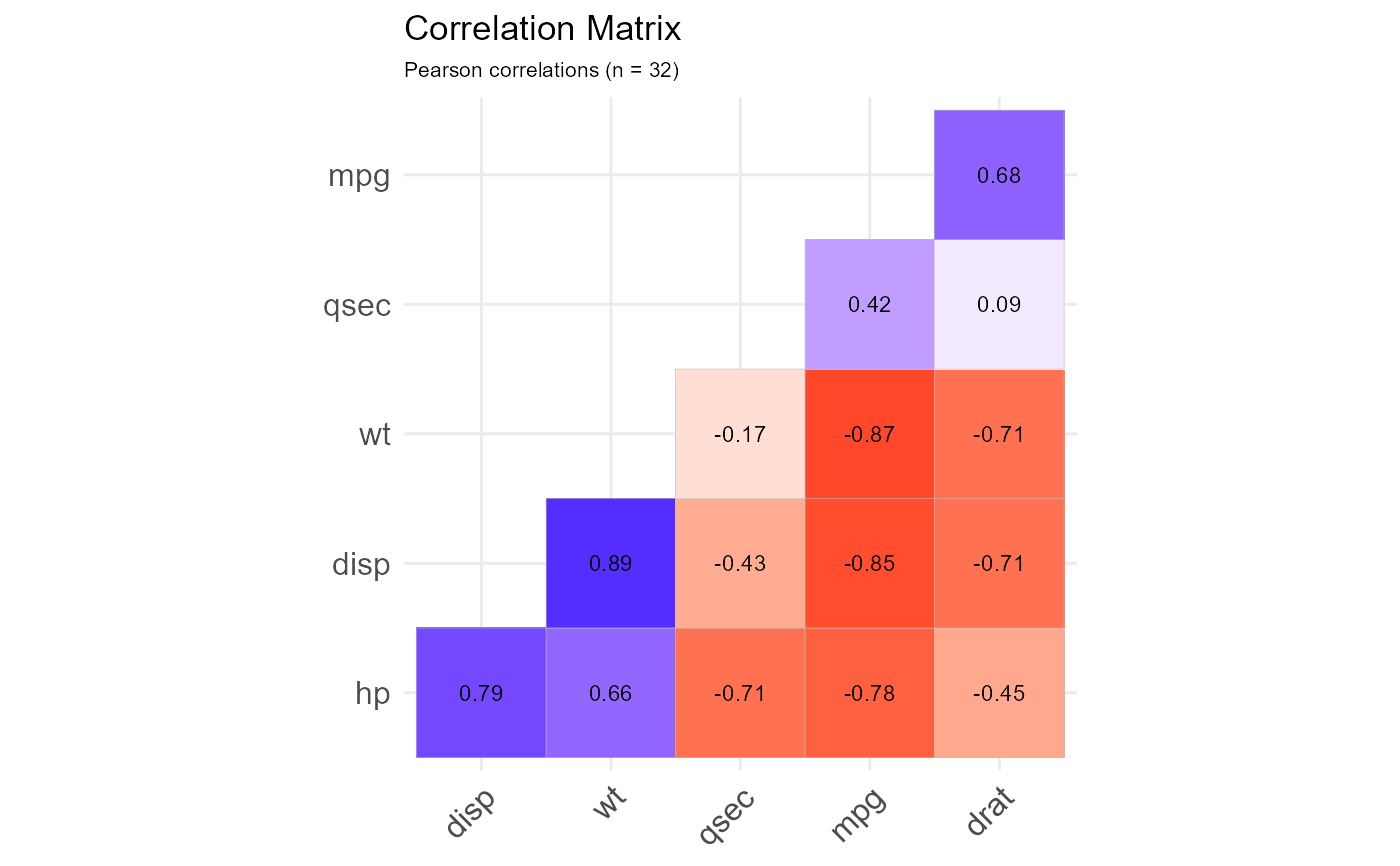
| sort | logical. If |
| axis_text_size | size for axis labels (default=12). |
| number_text_size | size for correlation coefficient labels (default=3). |
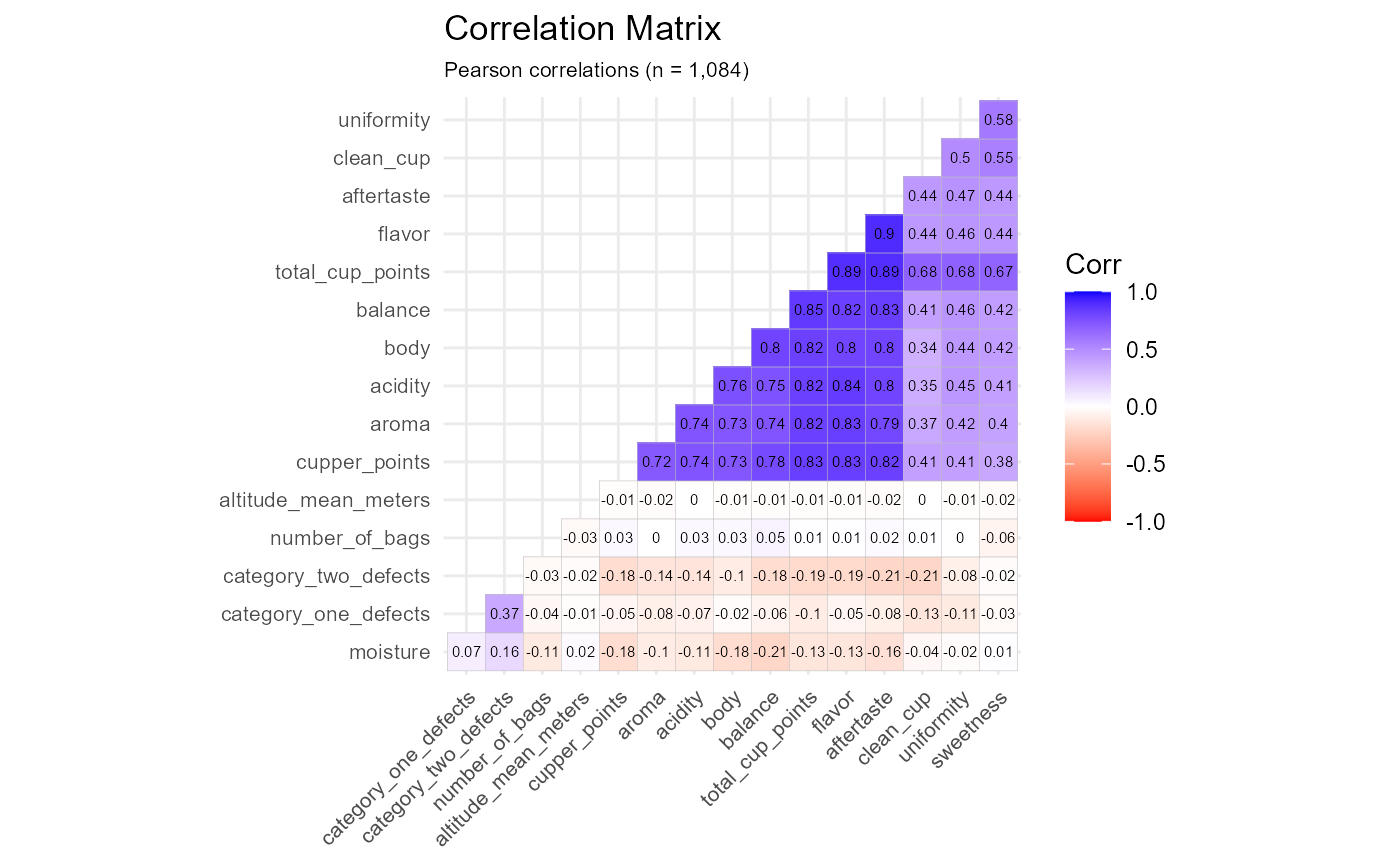
| legend | logical, if TRUE the legend is displayed. (default=FALSE) |
Value
a ggplot graph
Details
The cor_plot function will only select quantitative variables from
a data frame. Categorical variables are ignored.
The correlation matrix is presented as a lower triangle matrix.
Missing values are deleted in listwise fashion.
Note
This function is a wrapper for the ggcorrplot function.
Examples
cor_plot(cars74)cor_plot(cars74, sort=TRUE)cor_plot(coffee, axis_text_size=8, number_text_size=2, sort=TRUE, legend=TRUE)