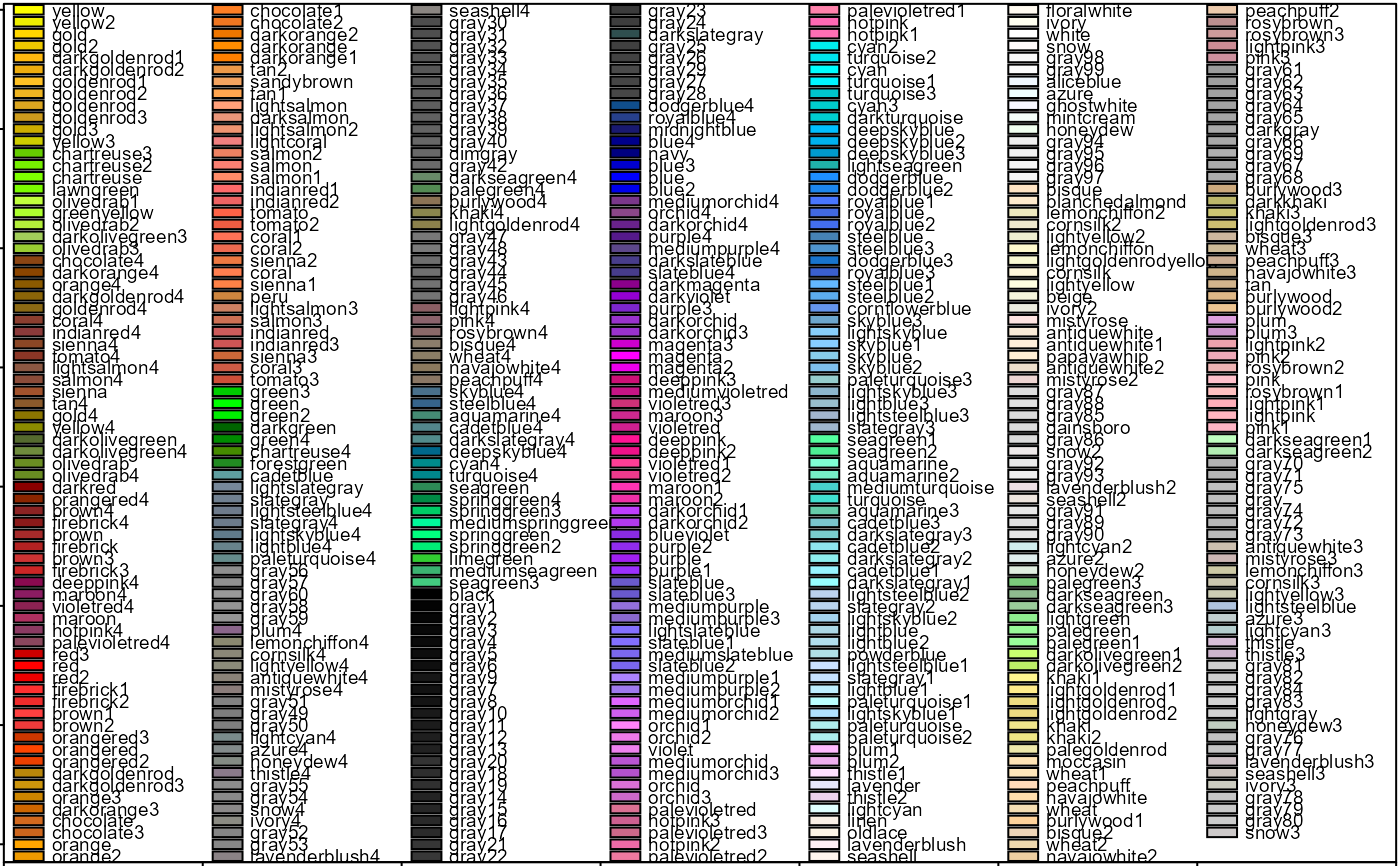
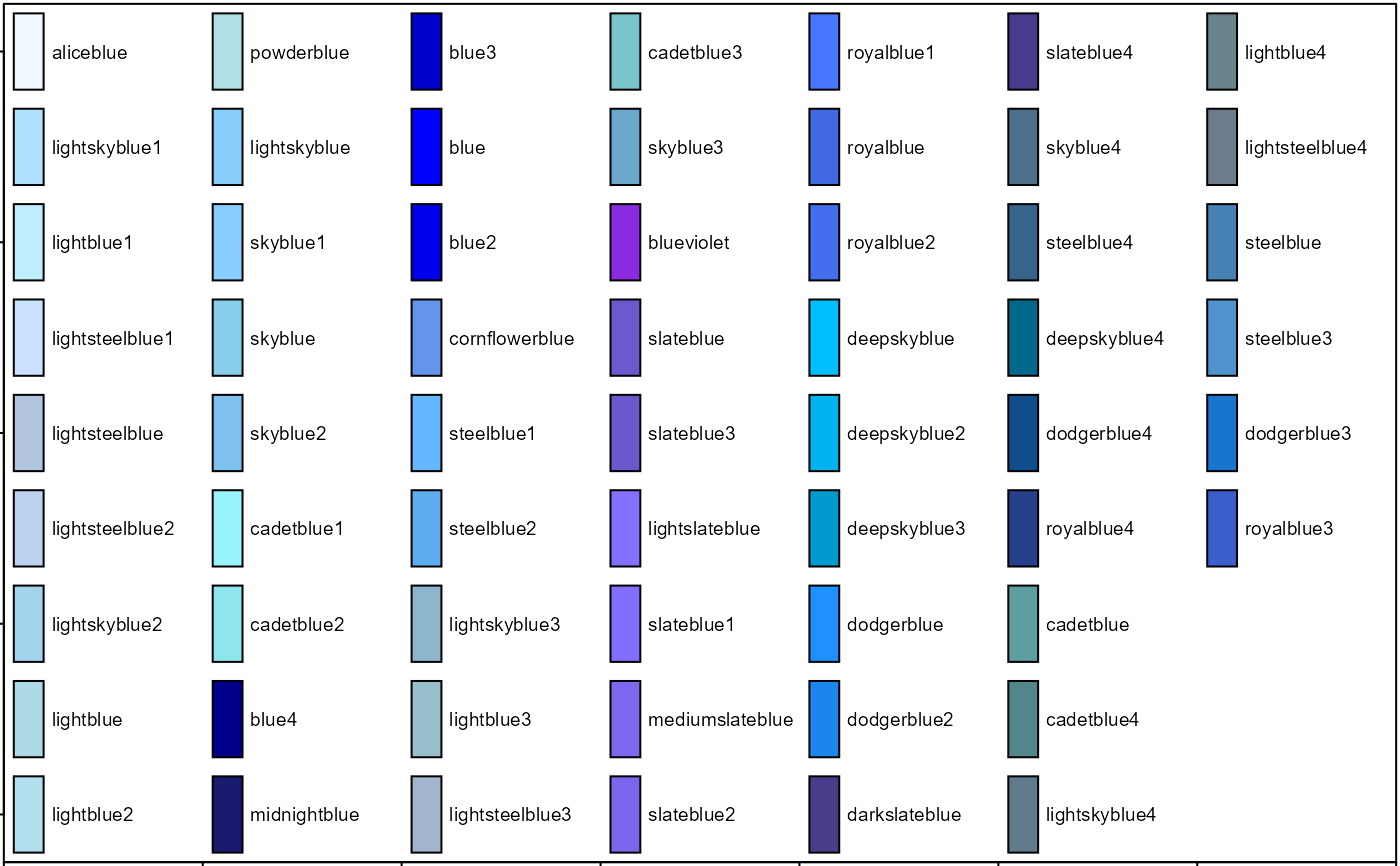
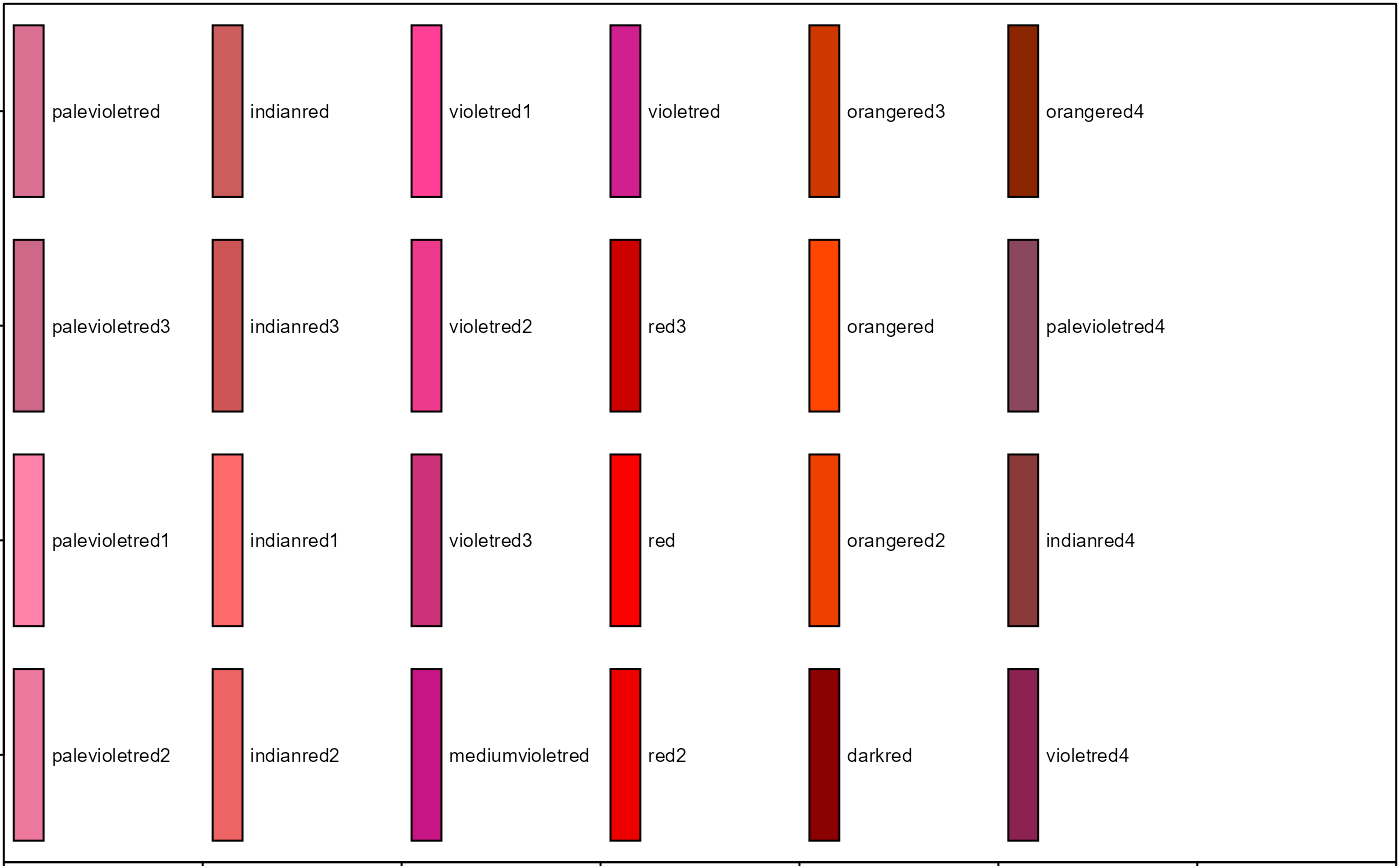
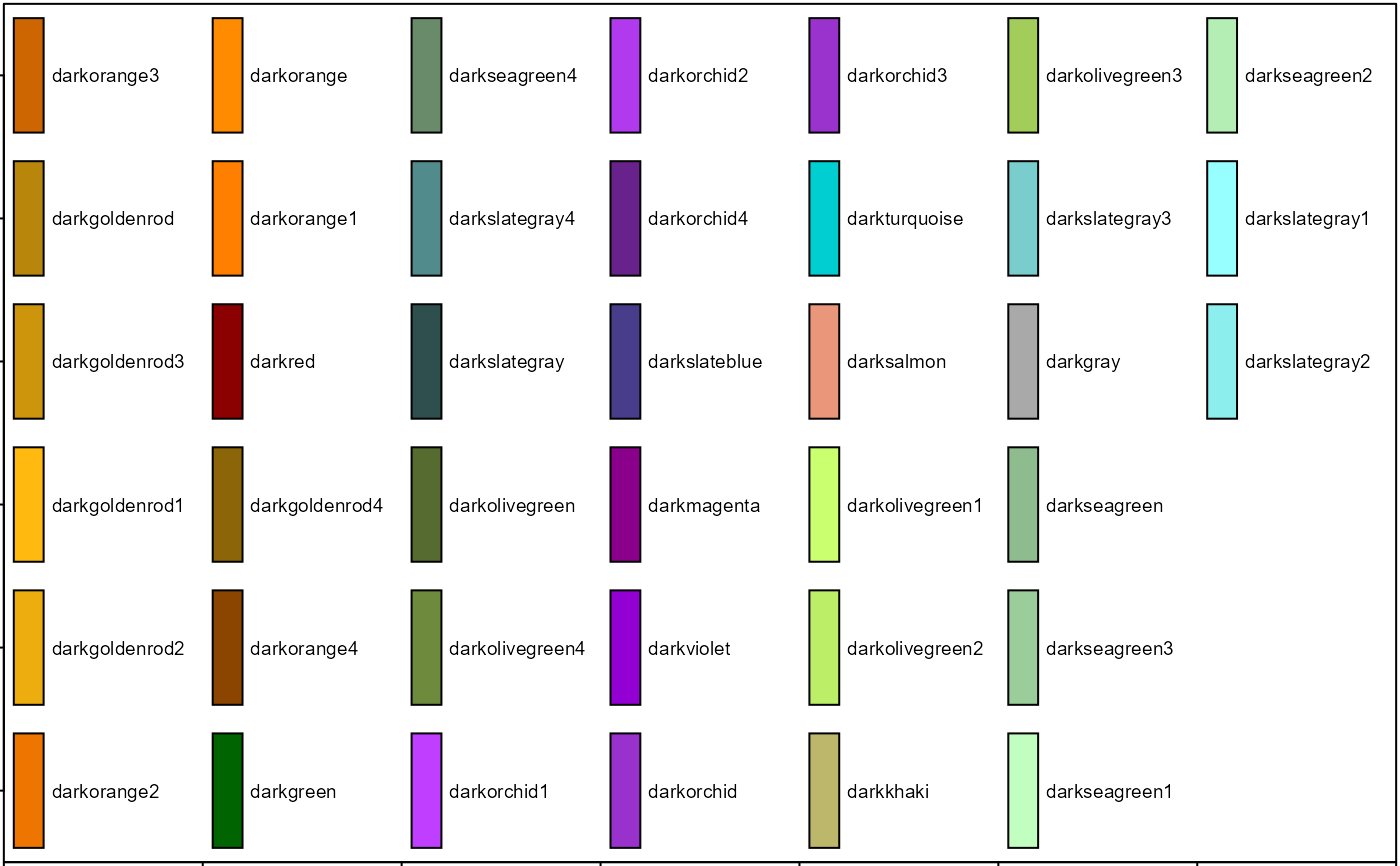
Plot a grid of R colors and their associated names
rcolors(color = NULL, cex = 0.6)
Arguments
| color | character. A text string used to search for specific color variations (see examples.) |
|---|---|
| cex | numeric. text size for color labels. |
Details
By default rcolors plots the basic 502 distinct colors provided by the
colors function. If a color name or part of a name is provided, only
colors with matching names are plotted.
References
This function is adapted from code published by Karl W. Broman.
See also
Examples
rcolors()rcolors("blue")rcolors("red")rcolors("dark")